6. Plotting#
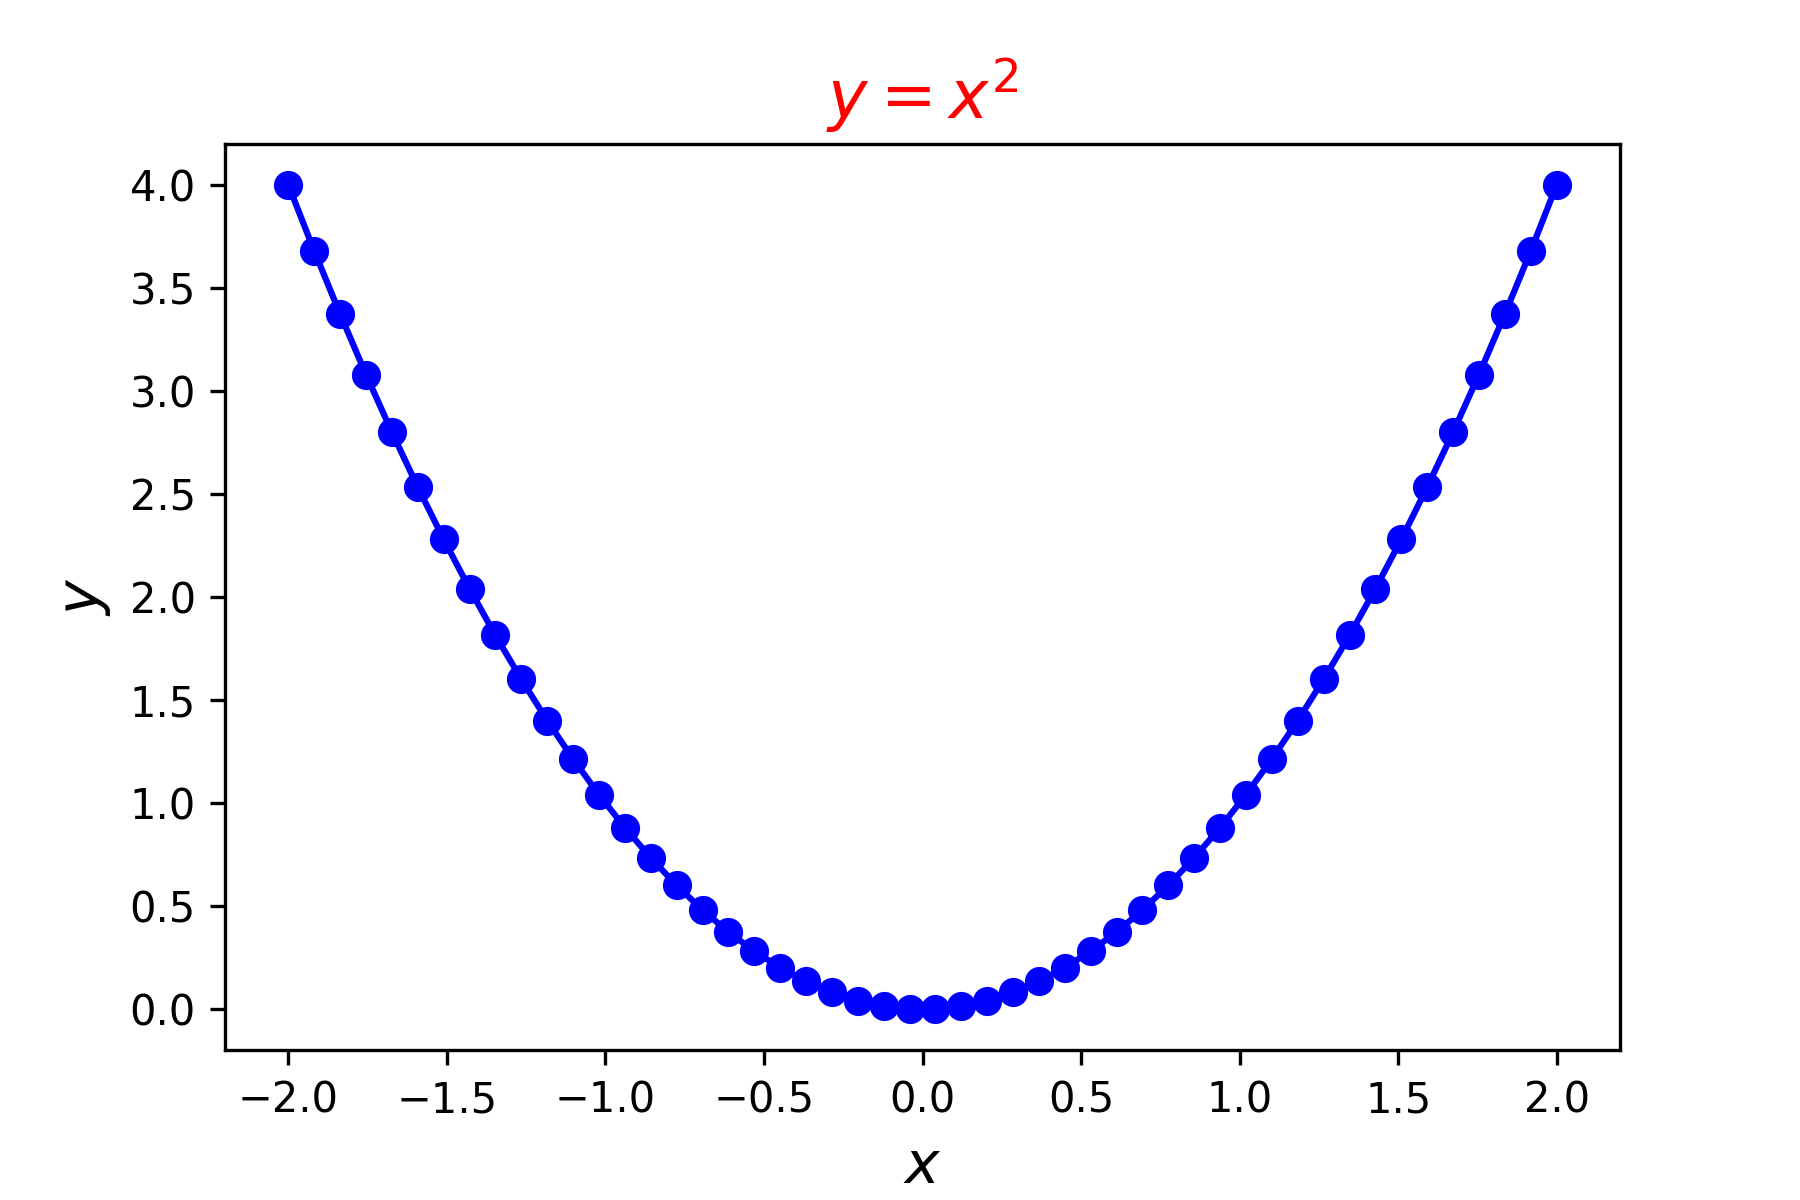
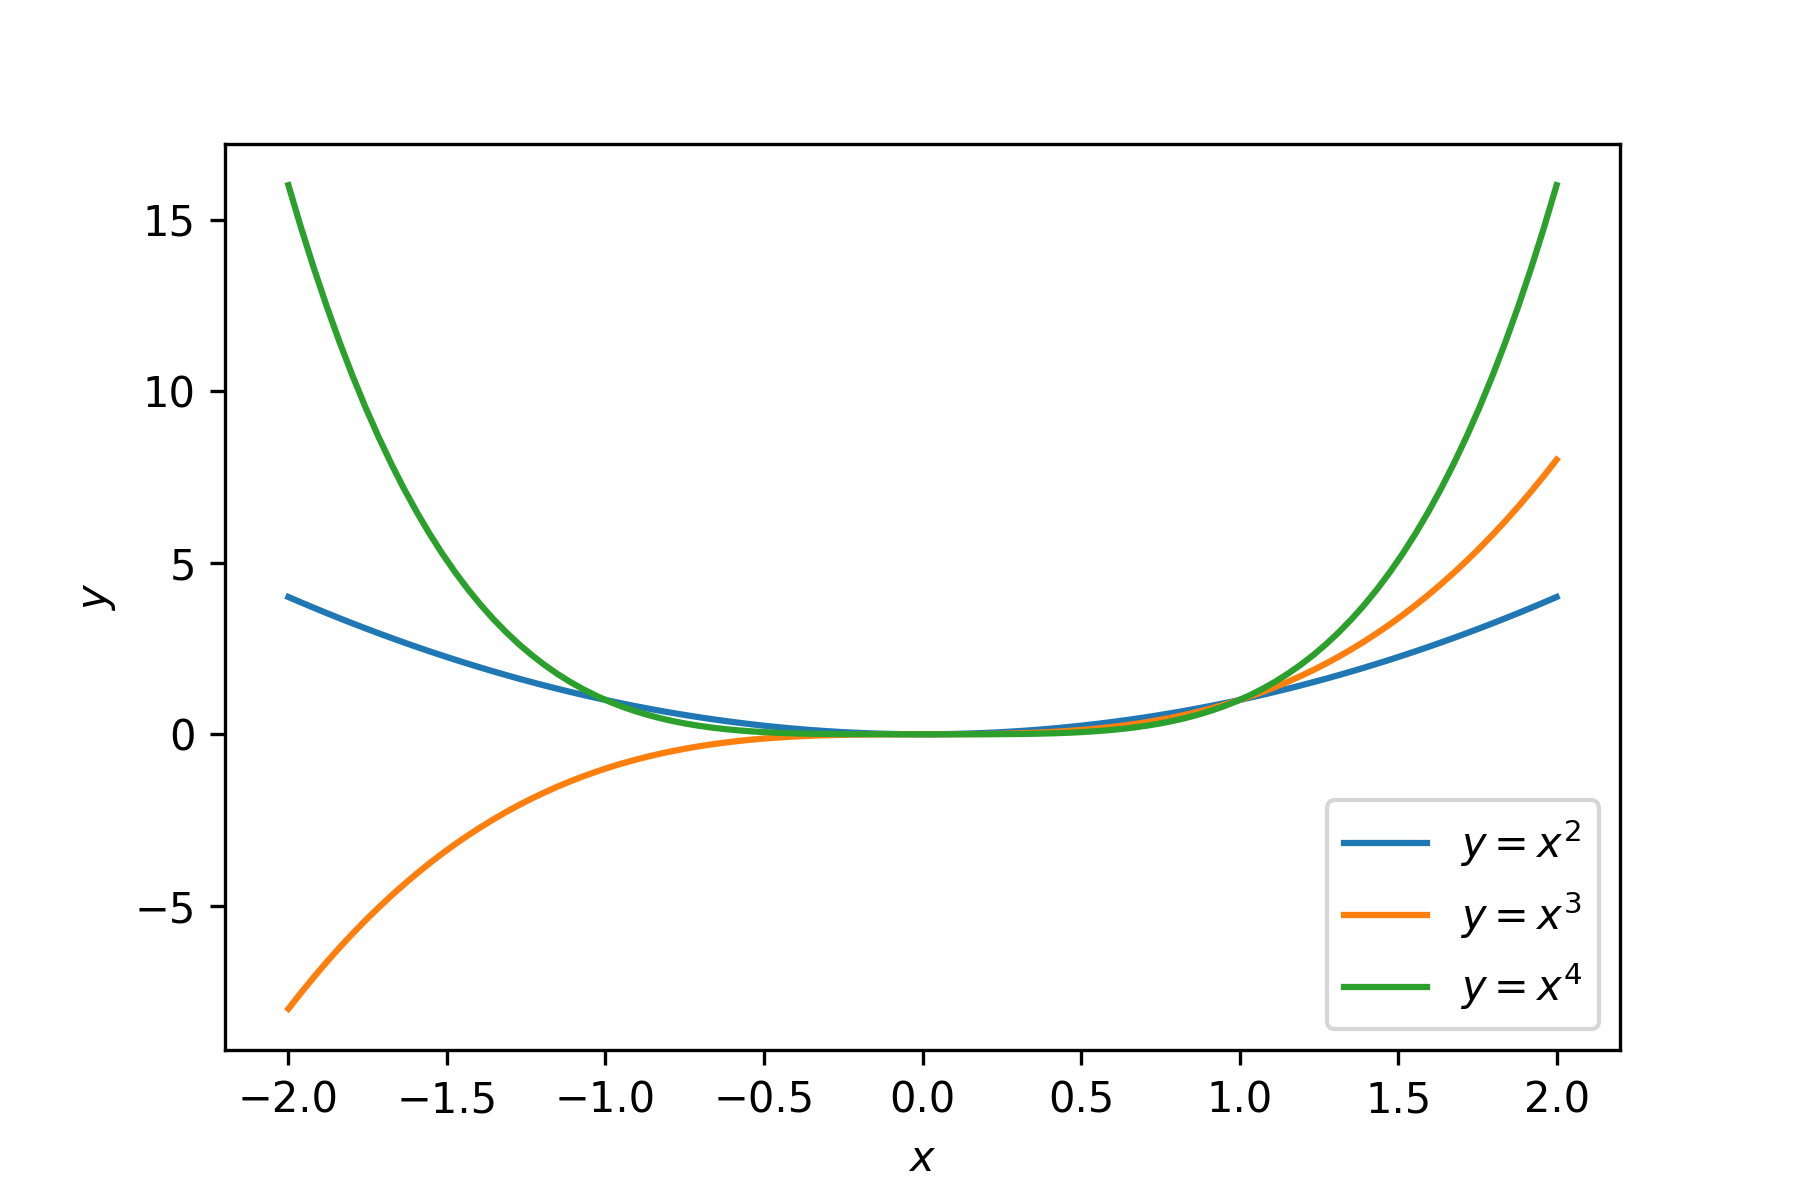
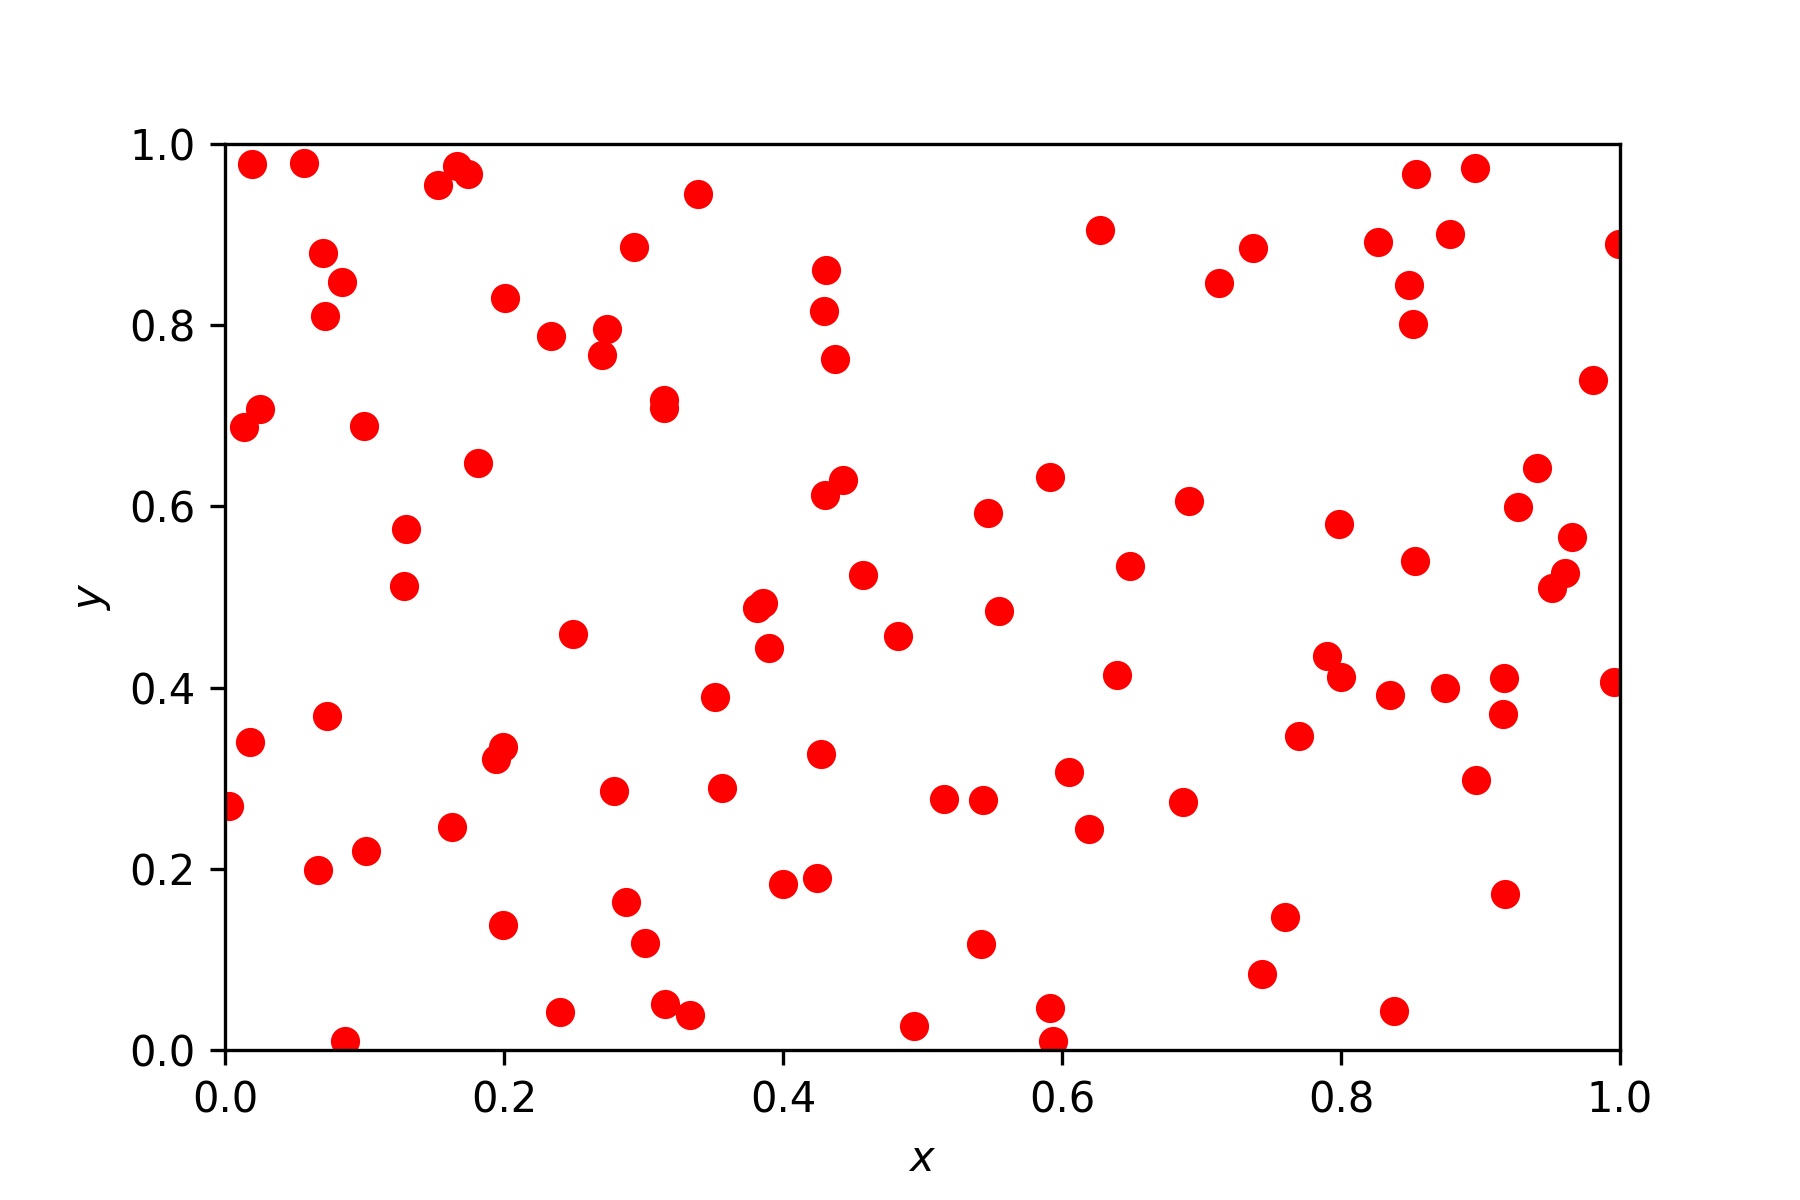
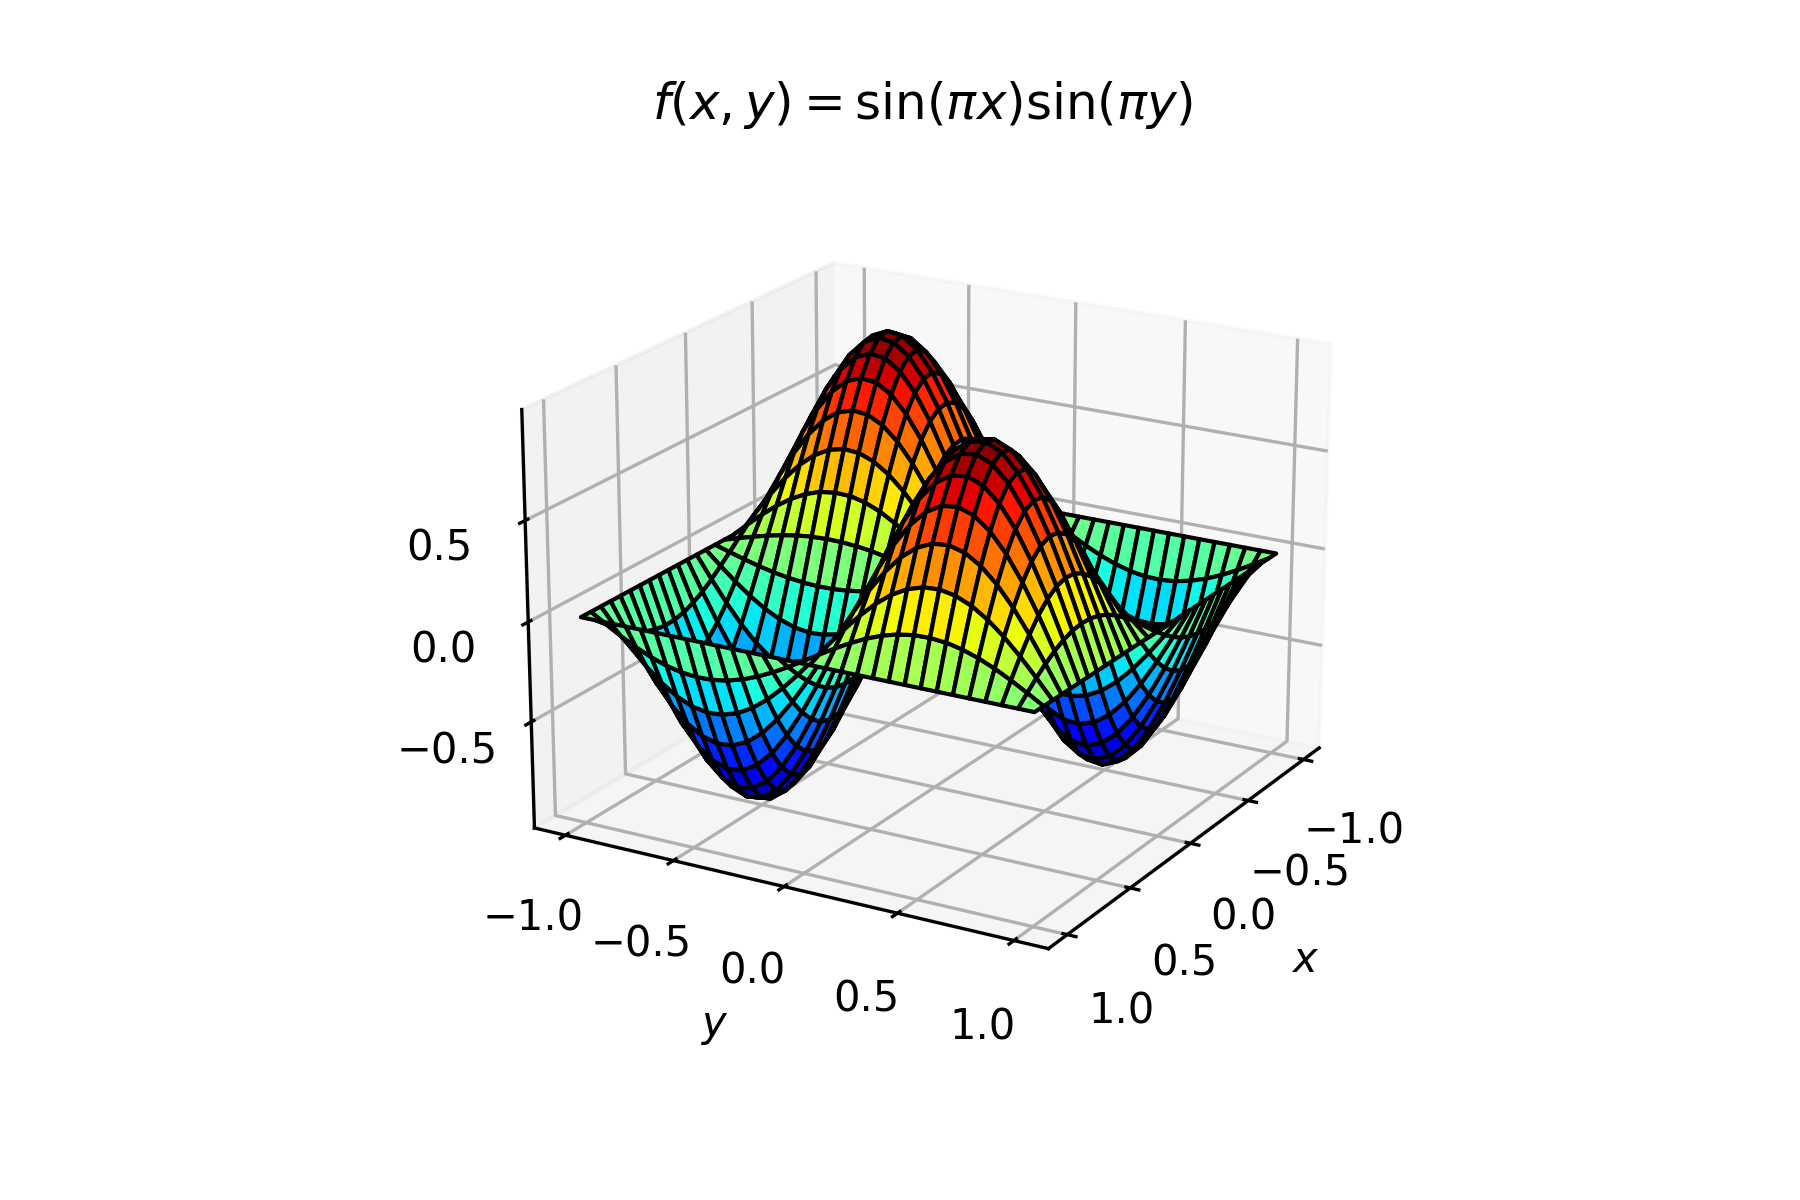
We can use Python to produce plots of data and save them to a file. Here we will look at how we can create the most common types of plots.
6.1. matplotlib#
matplotlib is a library of functions that allows us to produce plots of data within a Python program. Like with other libraries, we need to import it using the import command. For example, to import the matplotlib module pyplot which is used for the most common plots we use the following code
import matplotlib.pyplot as plt
This will allow us to call pyplot functions using the precursor plt..
