13.7. Exercise Solutions#
Solution to Exercise 13.1
% 13. Plotting Exercises

clear % Clear all variables
clc   % Clear command window

% Exercise 13.1
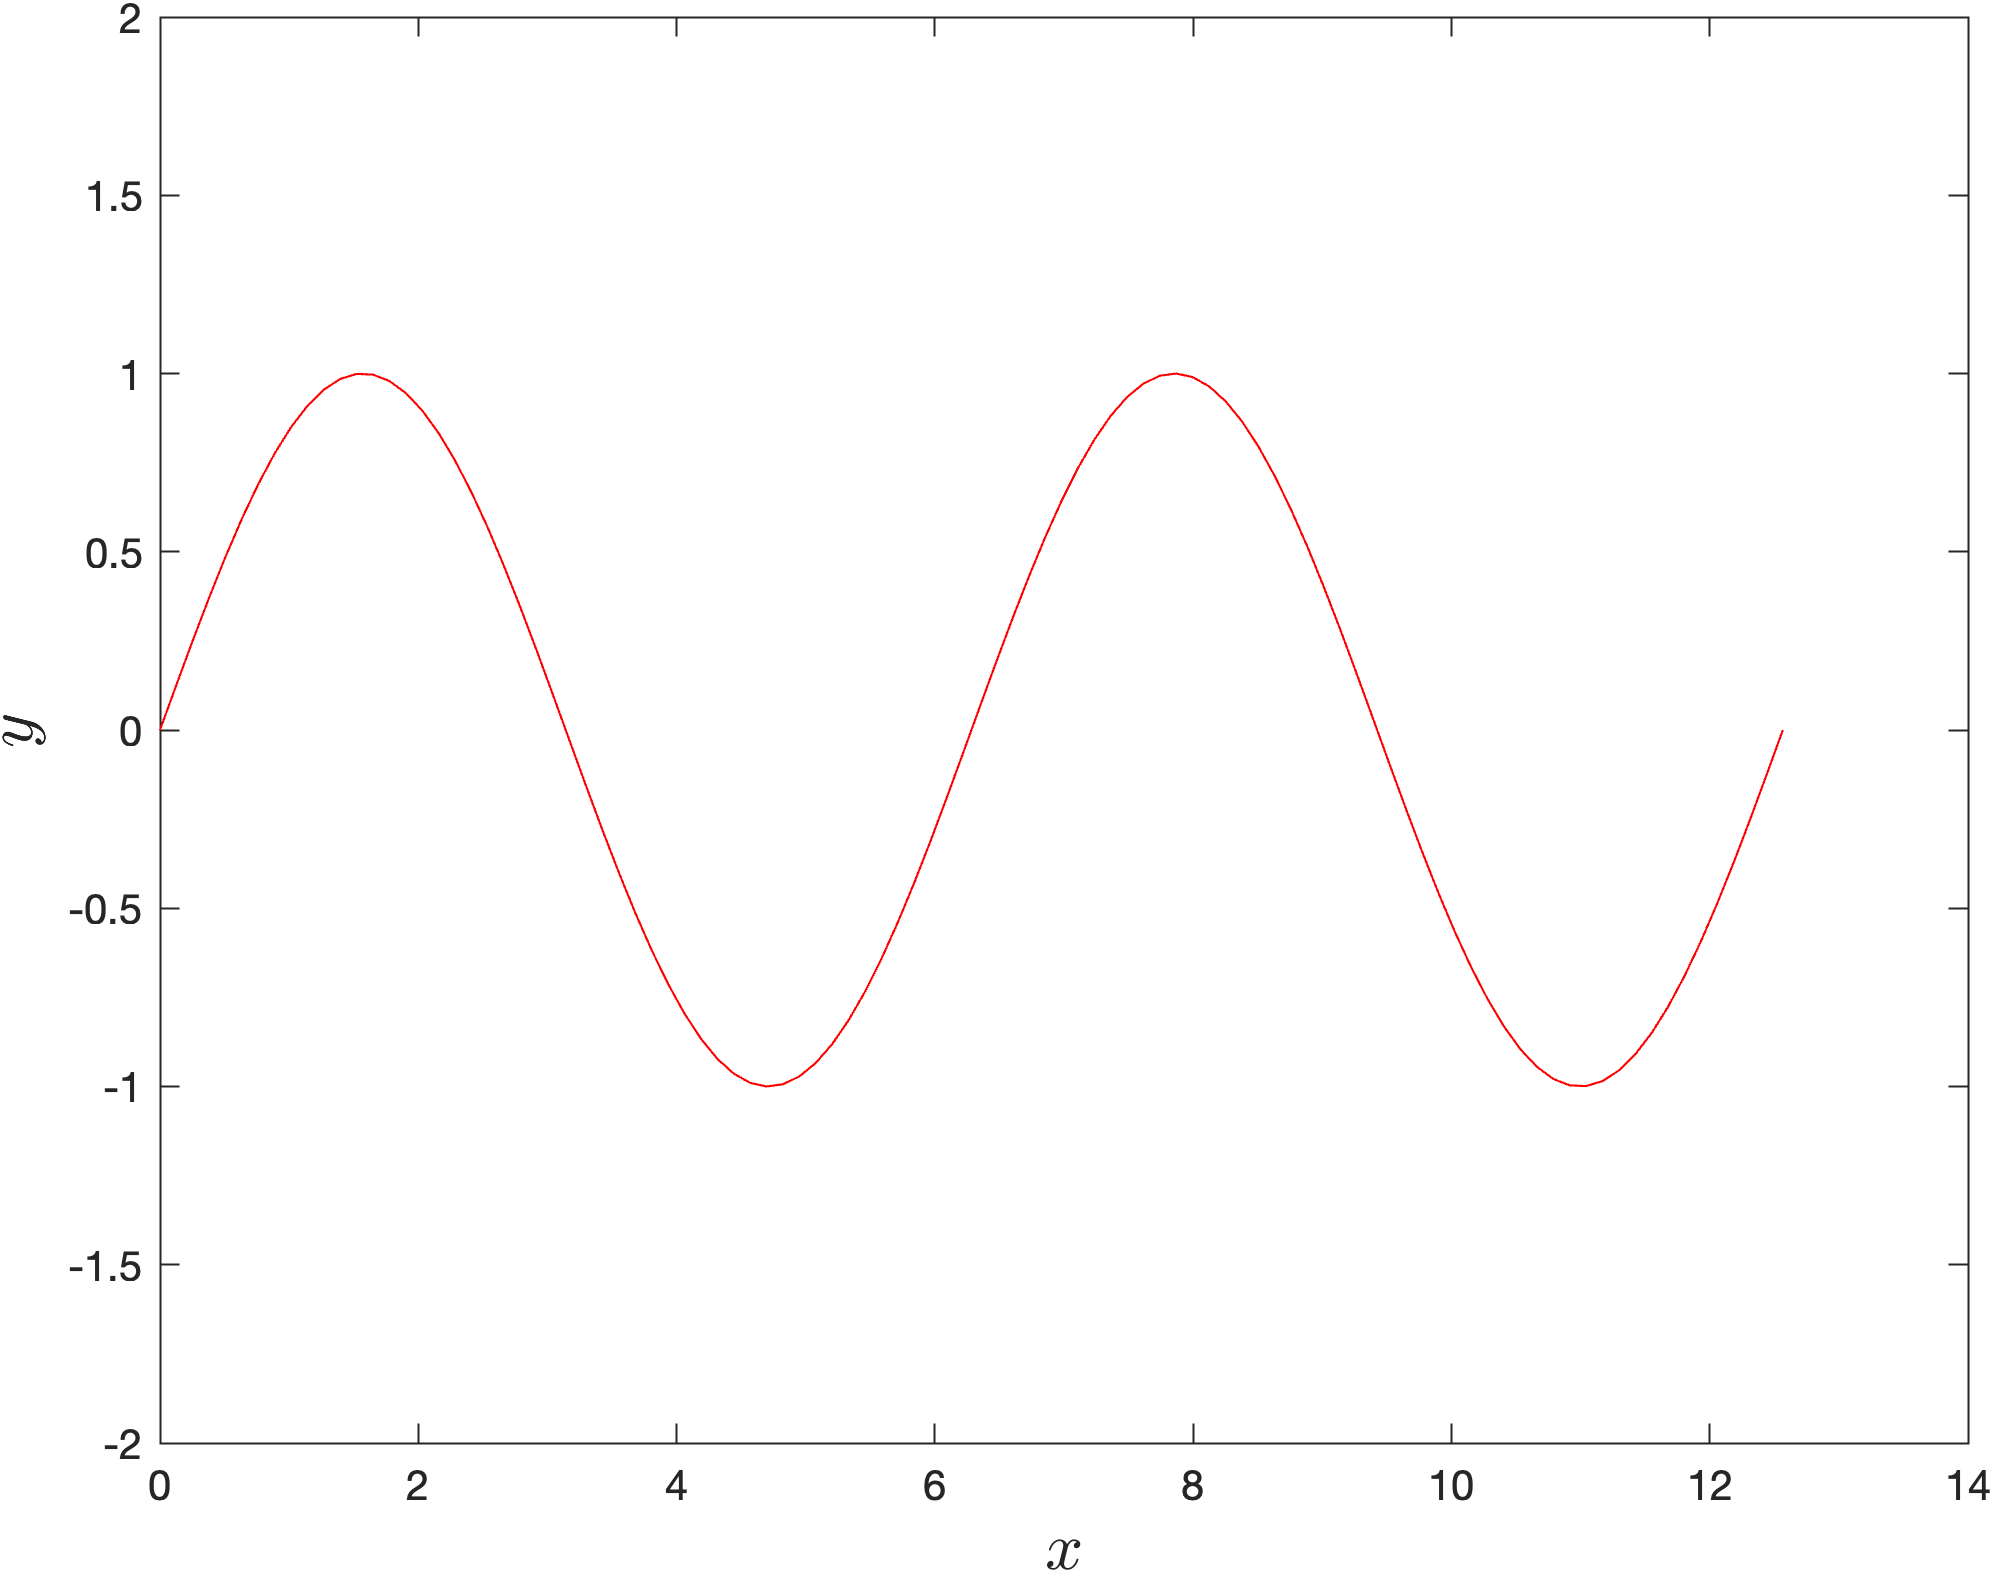
x = linspace(0, 4 * pi);
y = sin(x);

plot(x, y, 'r')
ylim([-2, 2])
xlabel('$x$', FontSize=16, Interpreter='latex')
ylabel('$y$', FontSize=16, Interpreter='latex')
Plot
Solution to Exercise 13.2
% -------------------------------------------------------------------------
% Exercise 13.2
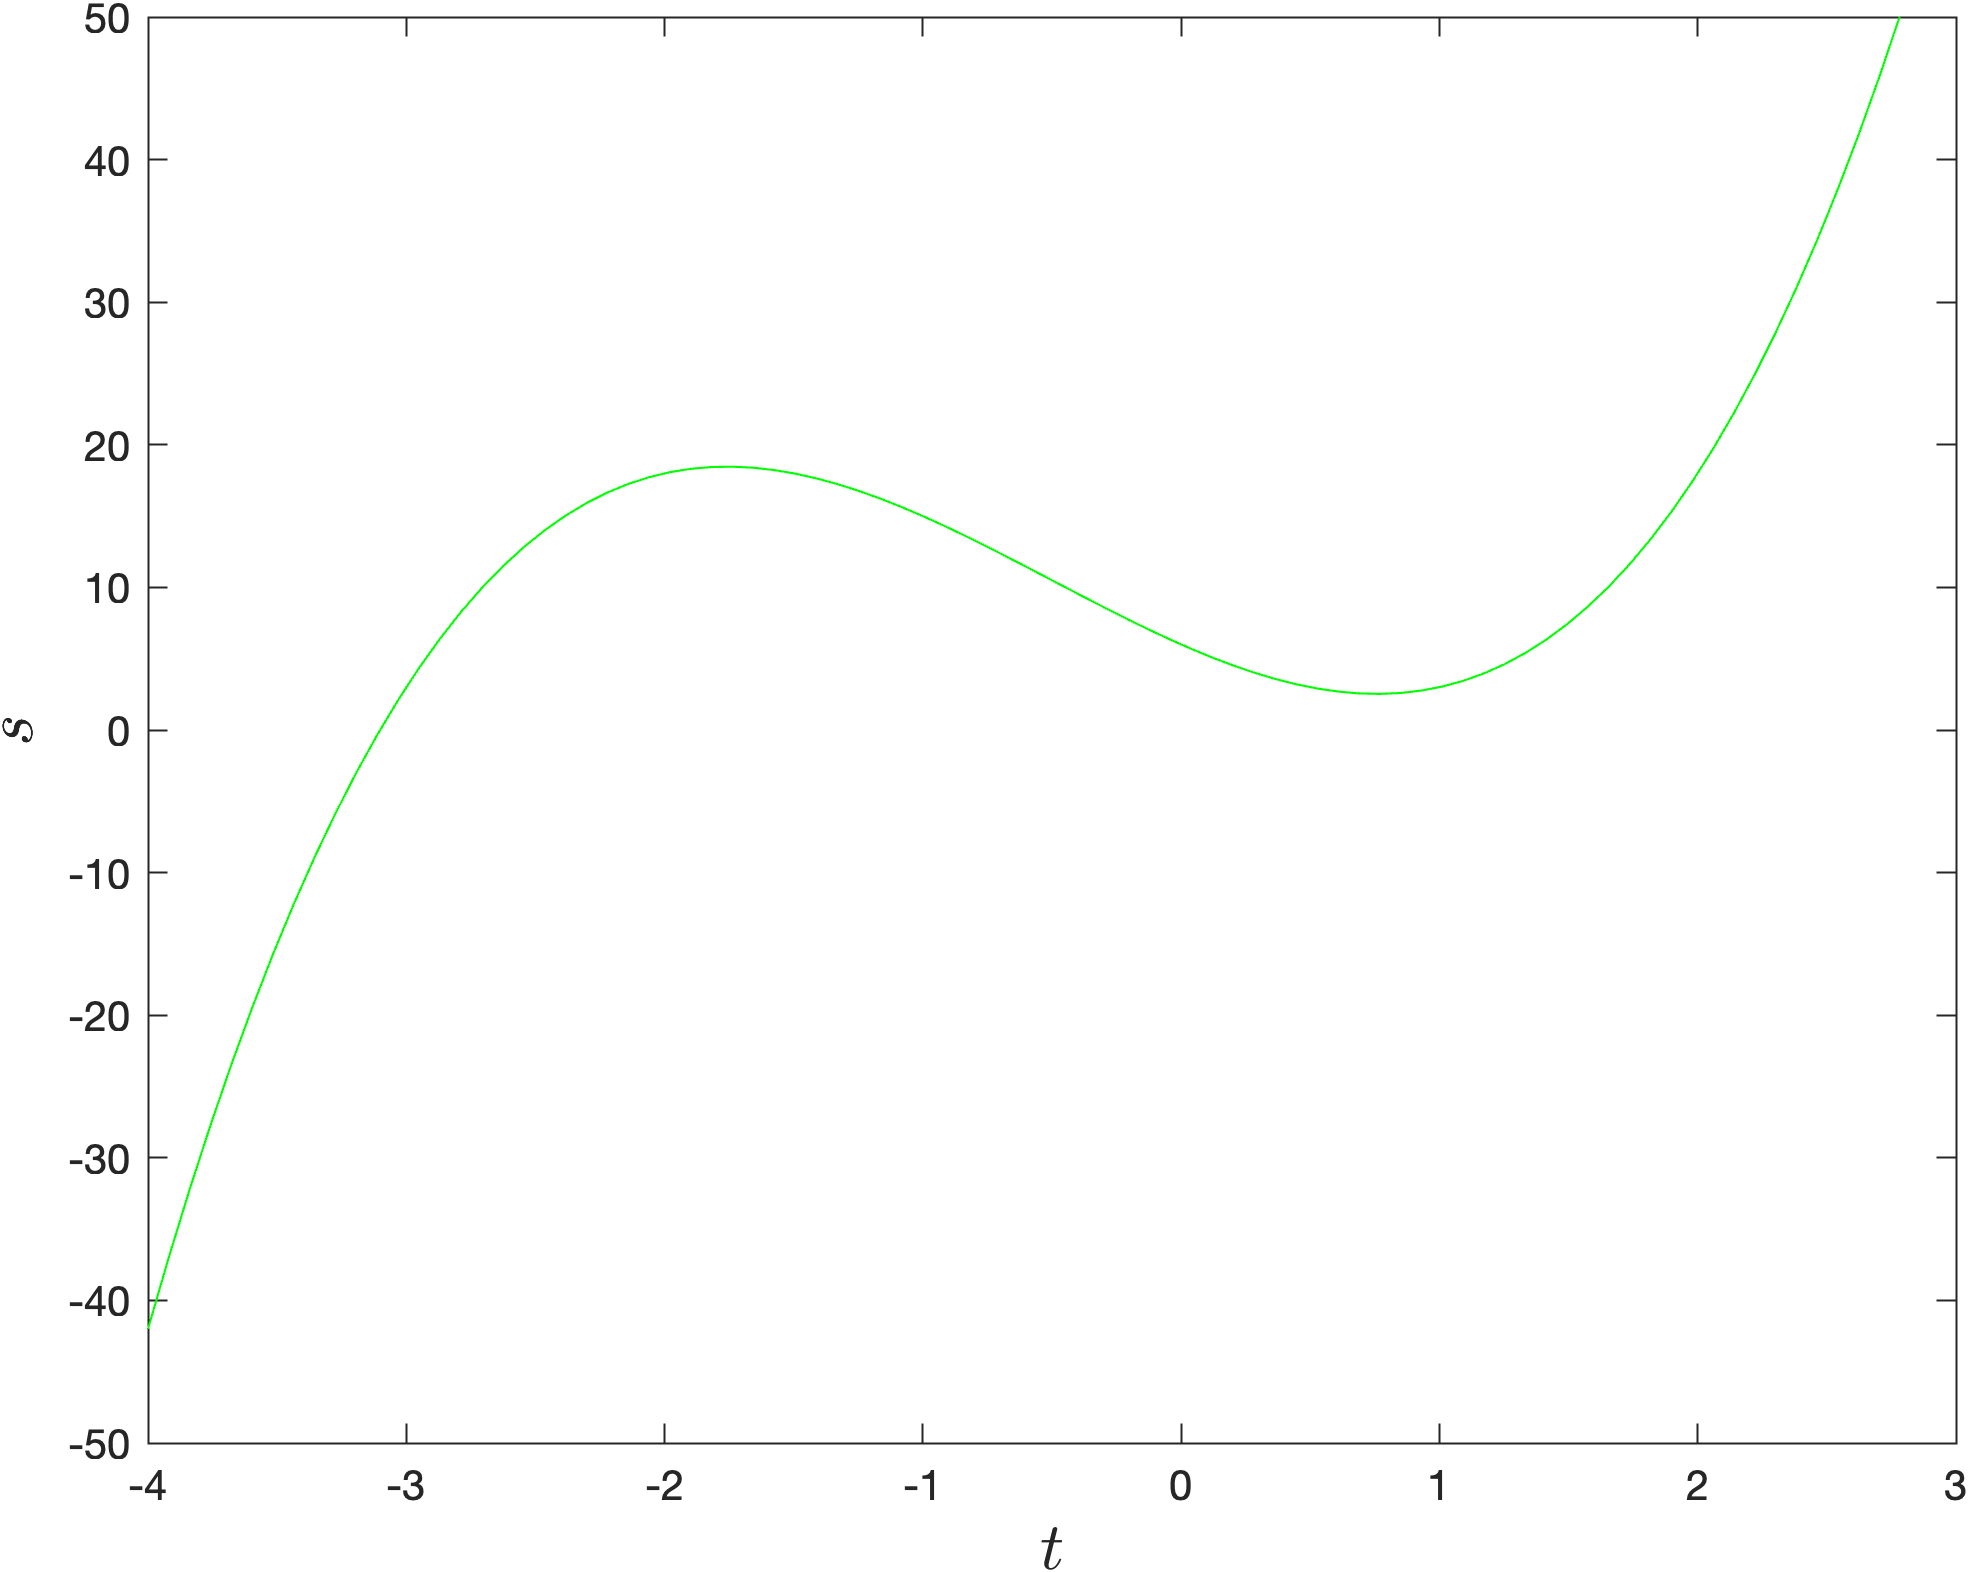
t = linspace(-4, 4, 100);
s = 2 * t .^ 3 + 3 * t .^ 2 - 8 * t + 6;

plot(t, s, 'g-')
ylim([-50, 50])
xlabel('$t$', FontSize=16, Interpreter='latex')
ylabel('$s$', FontSize=16, Interpreter='latex')
Plot
Solution to Exercise 13.3
% -------------------------------------------------------------------------
% Exercise 13.3
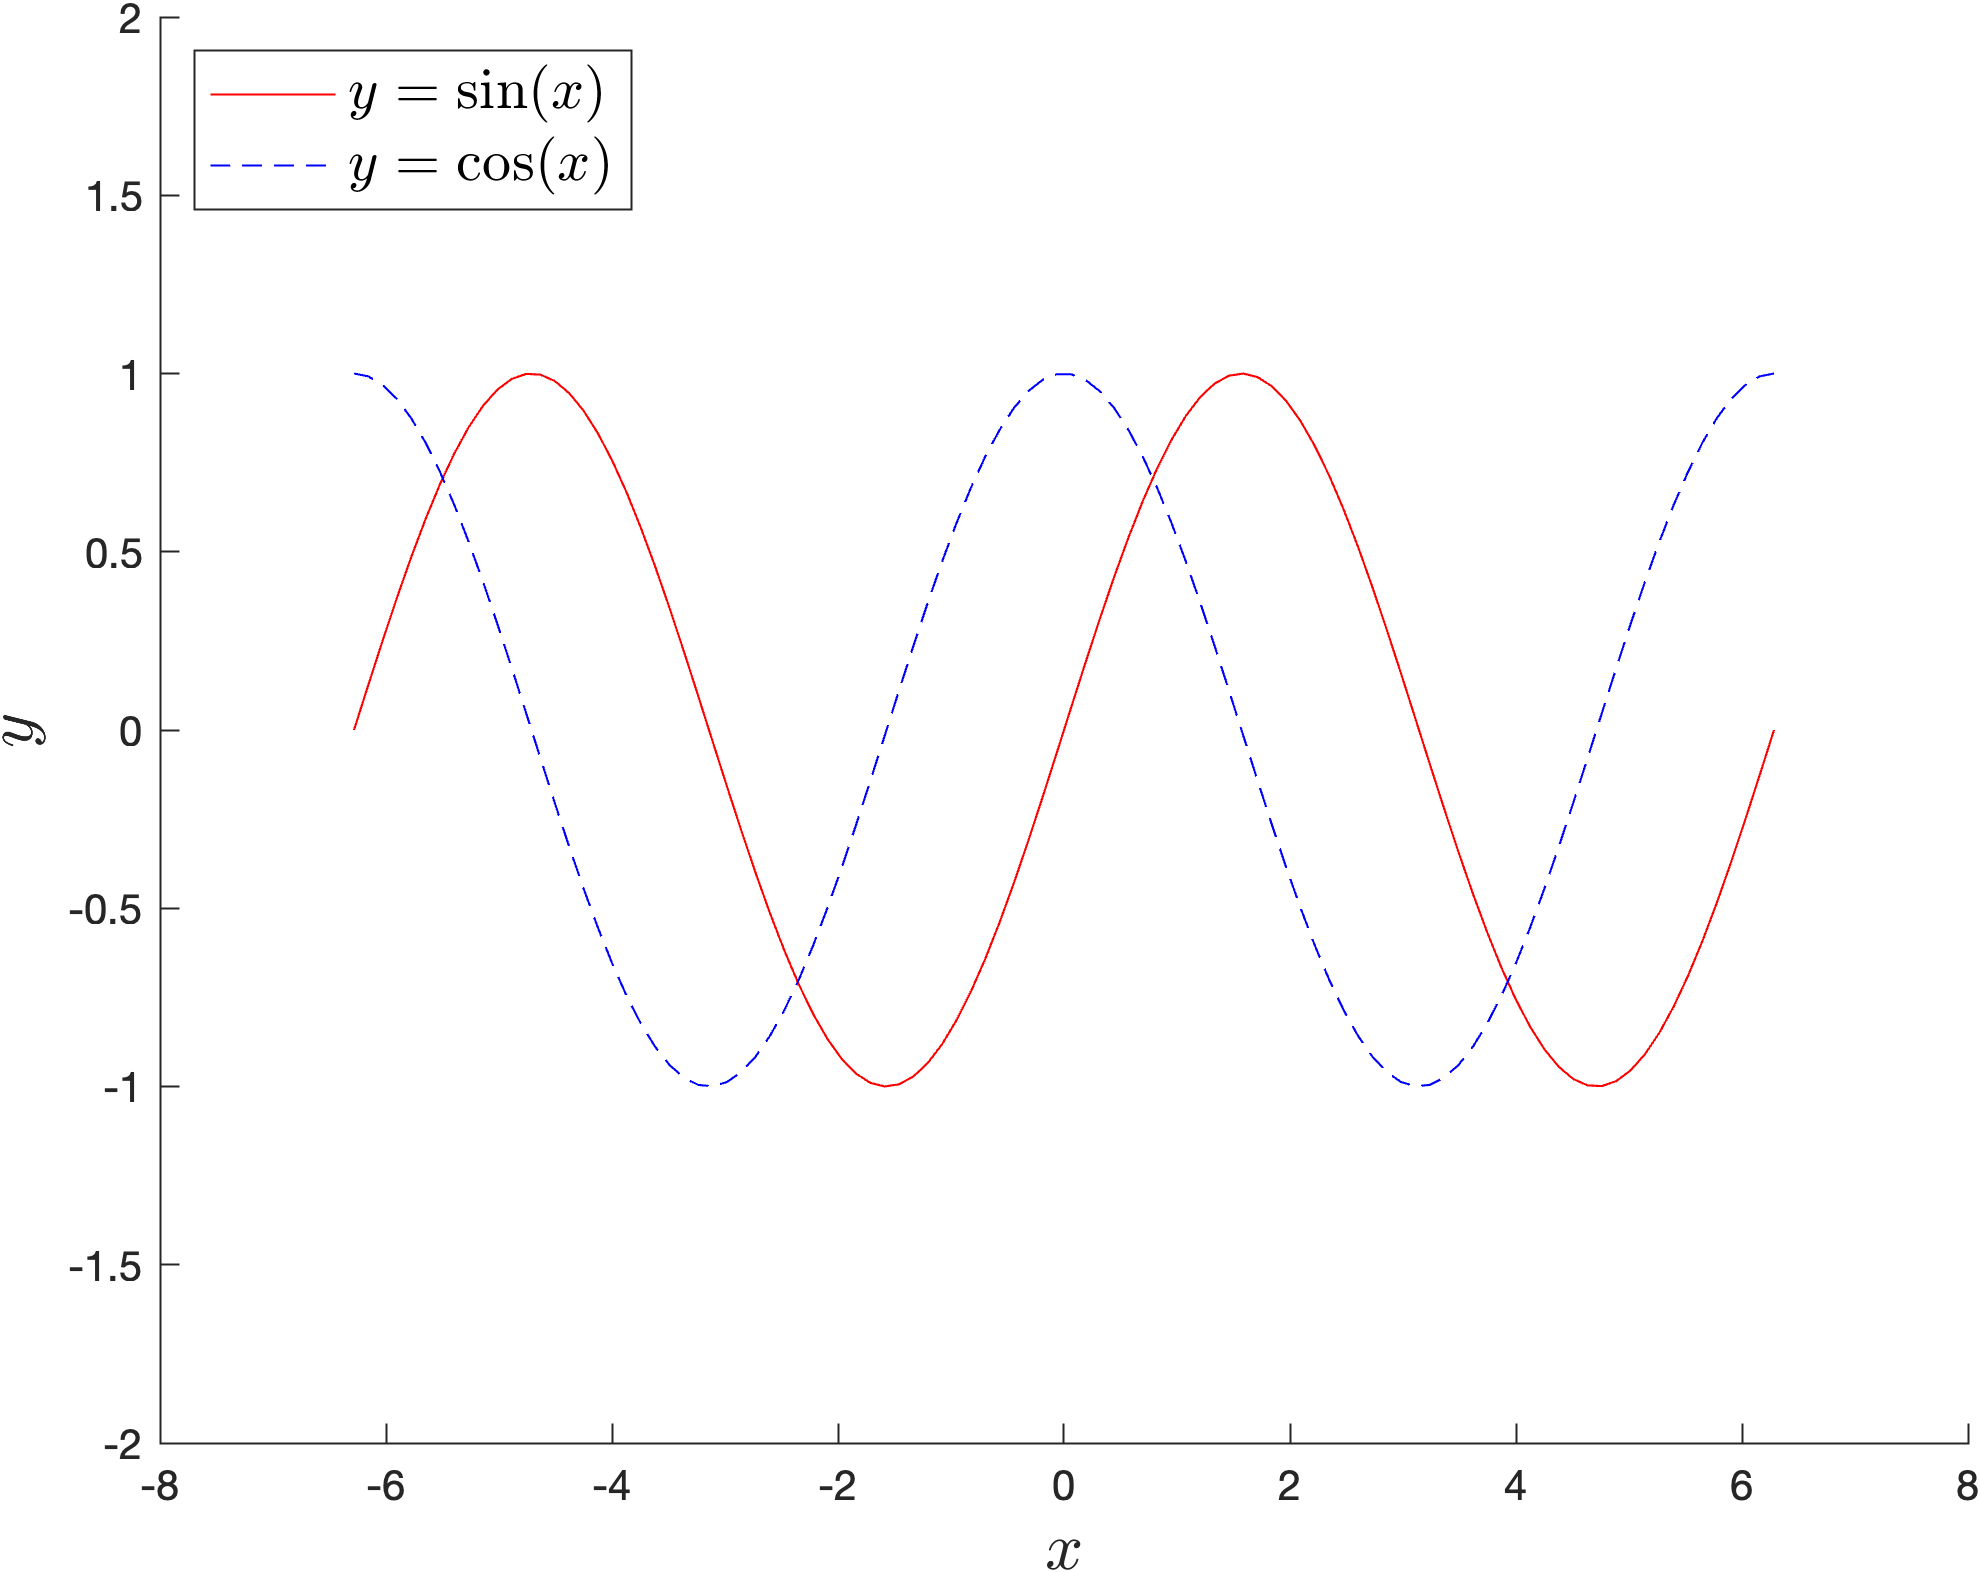
x = linspace(-2 * pi, 2 * pi, 100);
y1 = sin(x);
y2 = cos(x);

clf
hold on
plot(x, y1, 'r-')
plot(x, y2, 'b--')
hold off
ylim([-2, 2])
xlabel('$x$', FontSize=16, Interpreter='latex')
ylabel('$y$', FontSize=16, Interpreter='latex')
legend('$y = \sin(x)$', '$y = \cos(x)$', FontSize=14, Interpreter='latex', Location='northwest')
Plot
Solution to Exercise 13.4
% -------------------------------------------------------------------------
% Exercise 13.4
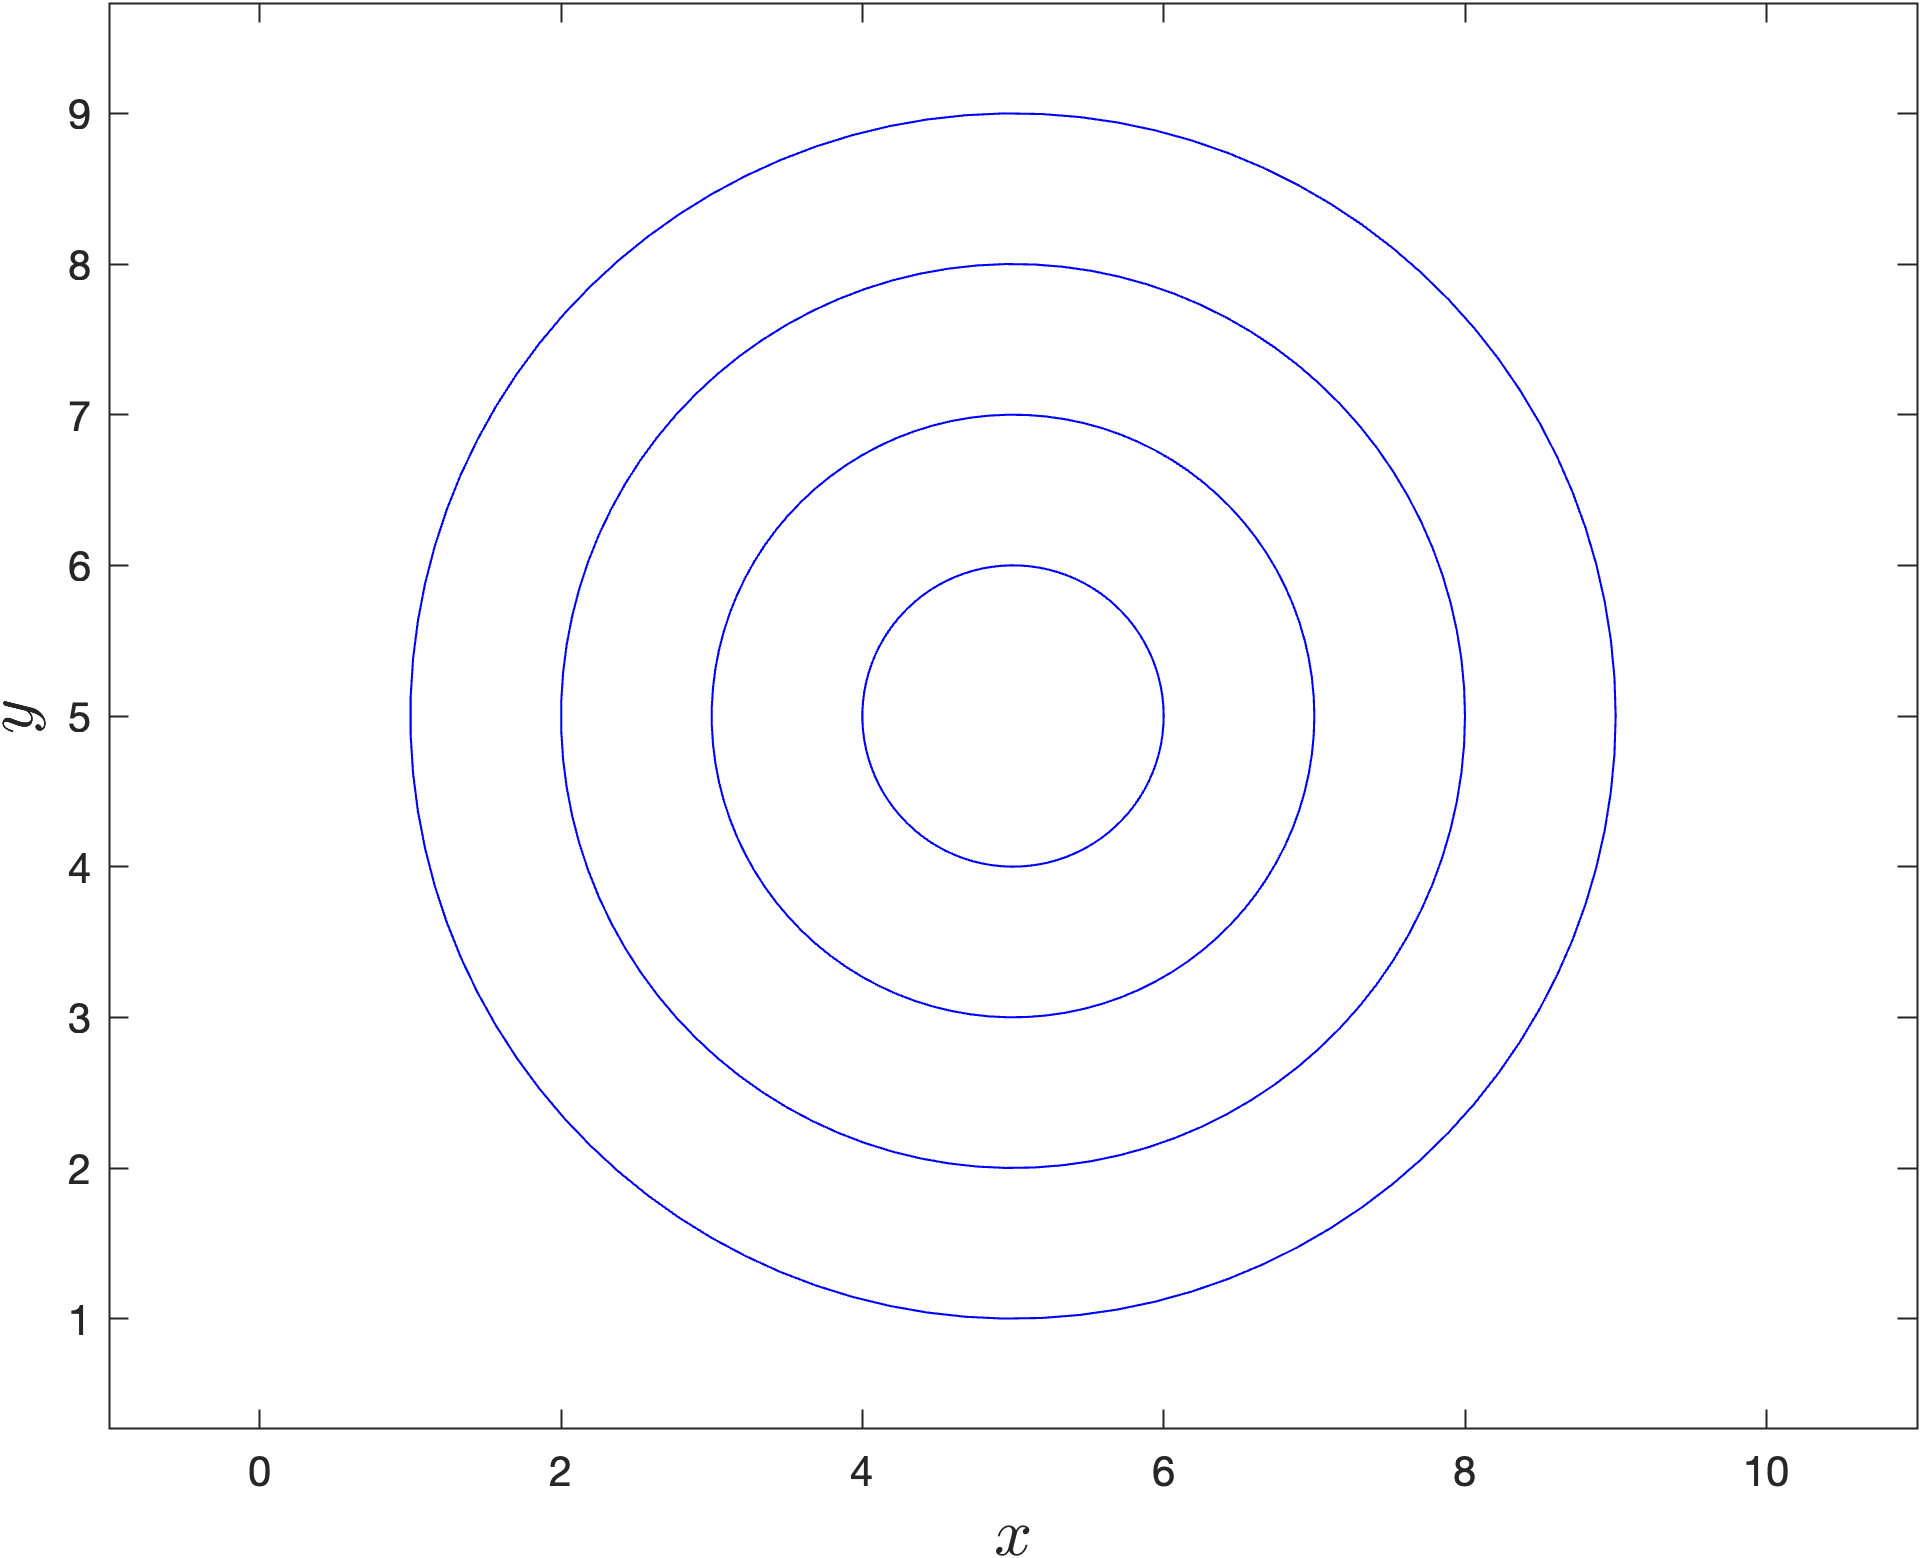
cx = 5;
cy = 5;
radius = [1, 2, 3, 4];
theta = linspace(0, 2 * pi, 100);

clf
for r = radius
    x = cx + r * cos(theta);
    y = cy + r * sin(theta);

    plot(x, y, 'b-')
    hold on
end
hold off
xlabel('$x$', FontSize=16, Interpreter='latex')
ylabel('$y$', FontSize=16, Interpreter='latex')
axis equal padded
Plot
Solution to Exercise 13.5
% -------------------------------------------------------------------------
% Exercise 13.5
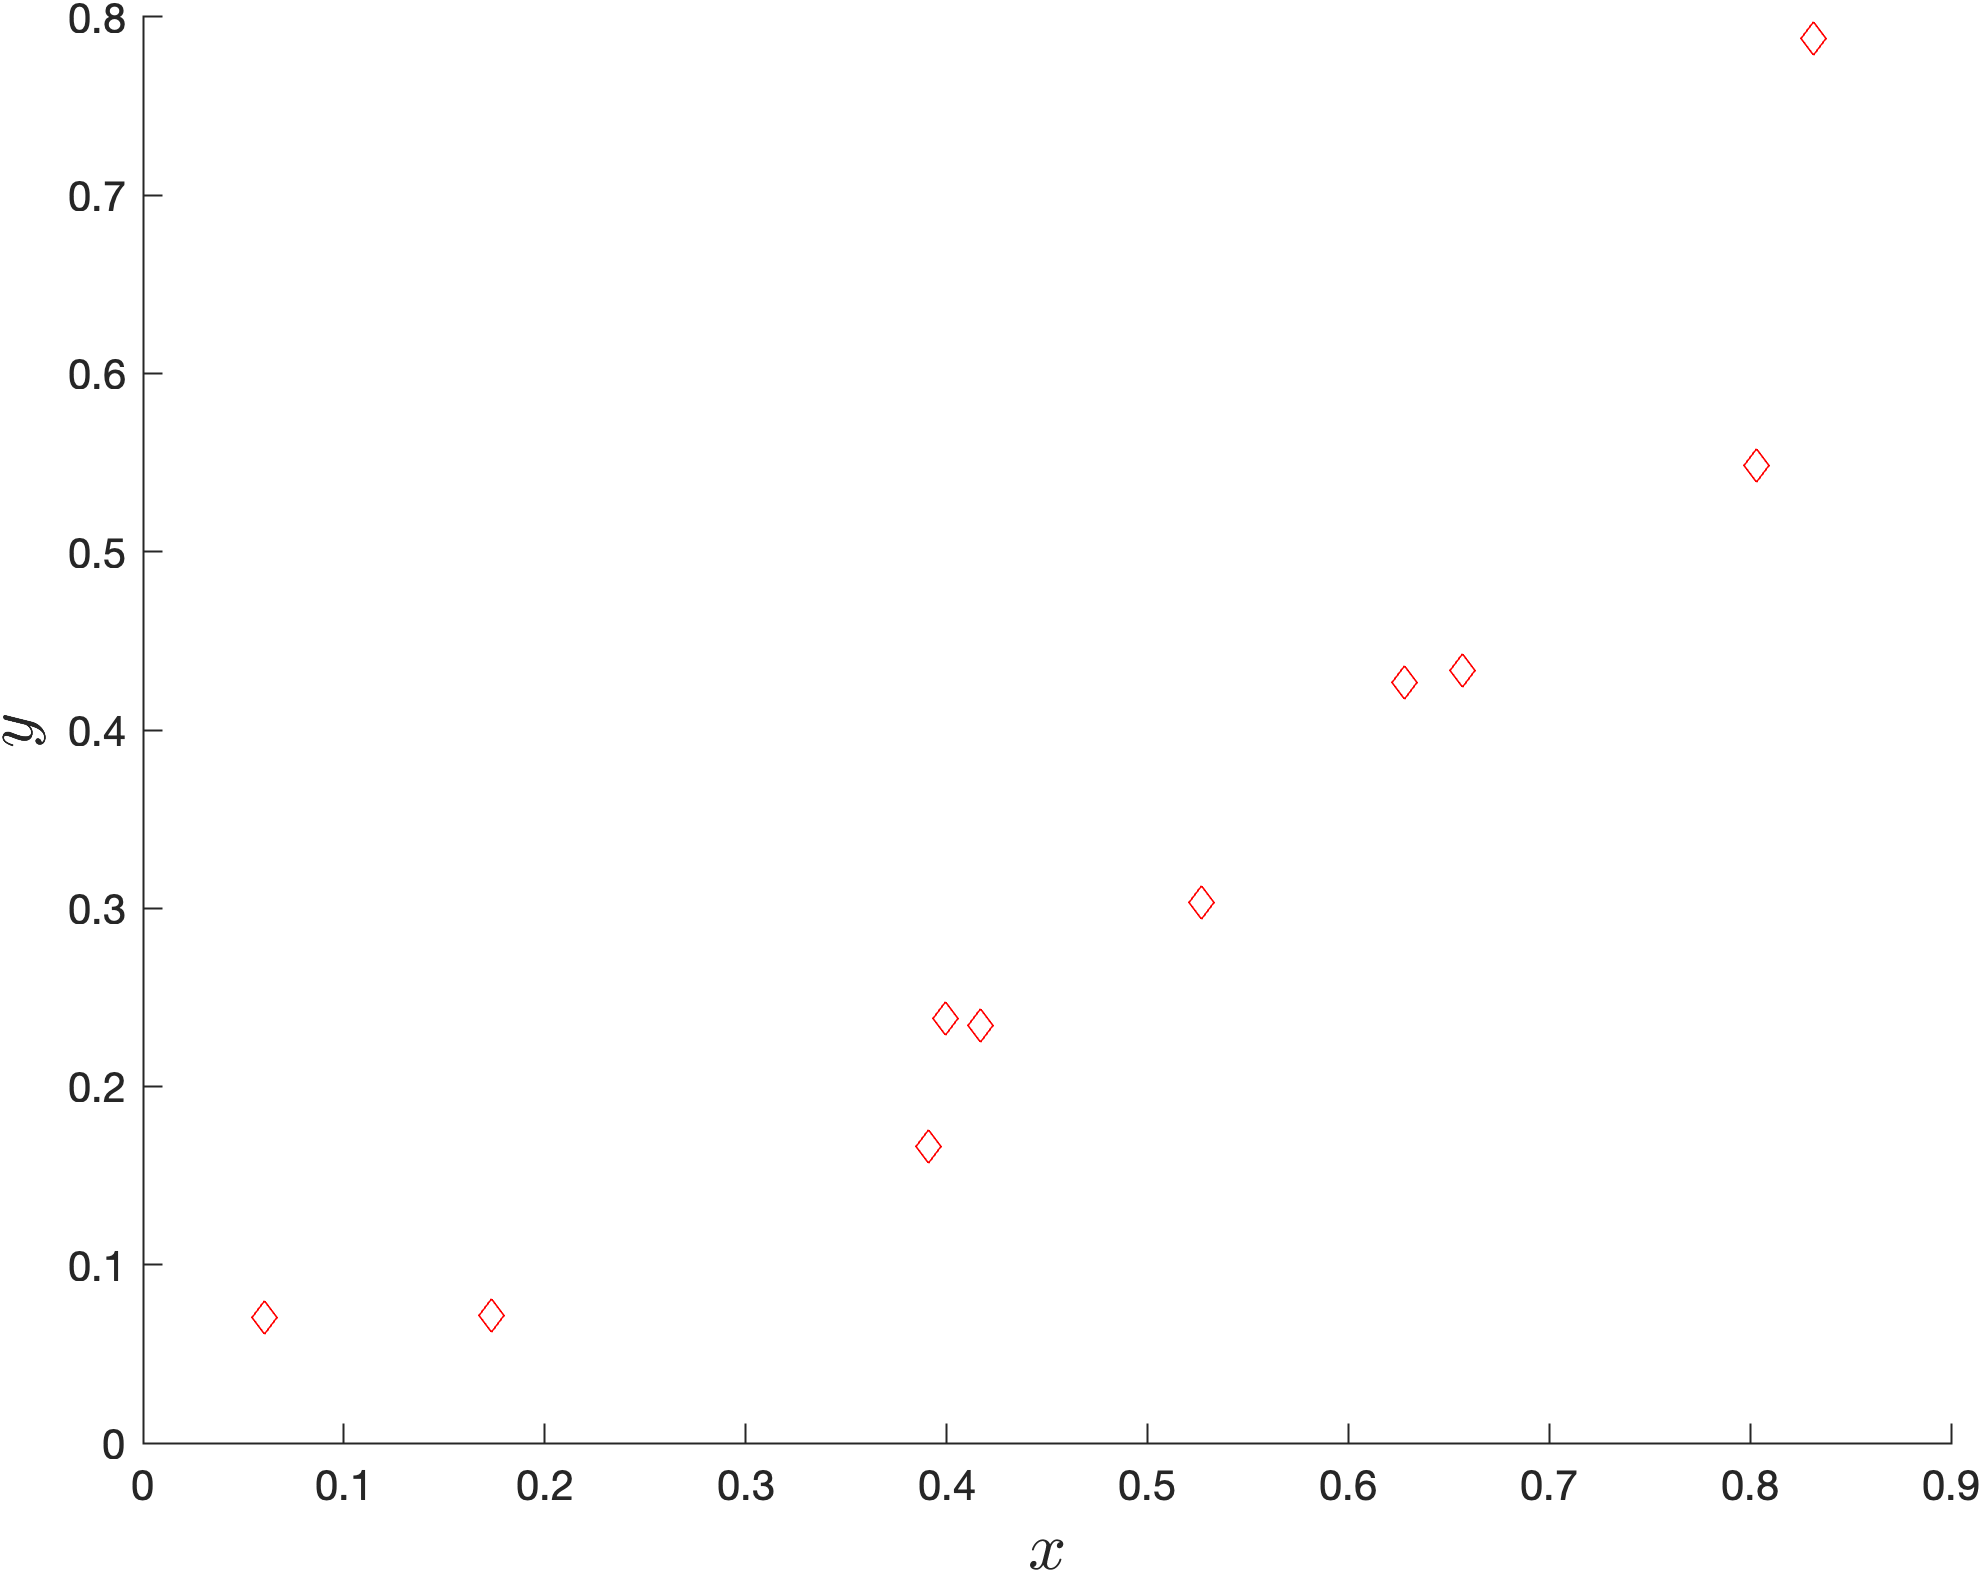
x = [ 0.1734, 0.3909, 0.8314, 0.8034, 0.0605, 0.3993, 0.5269, 0.4168, 0.6569, 0.6280 ];
y = [ 0.0717, 0.1665, 0.7881, 0.5486, 0.0702, 0.2382, 0.3031, 0.2341, 0.4335, 0.4265 ];

scatter(x, y, 'rdiamond')
xlabel('$x$', FontSize=16, Interpreter='latex')
ylabel('$y$', FontSize=16, Interpreter='latex')
Plot
Solution to Exercise 13.6
% -------------------------------------------------------------------------
% Exercise 13.6
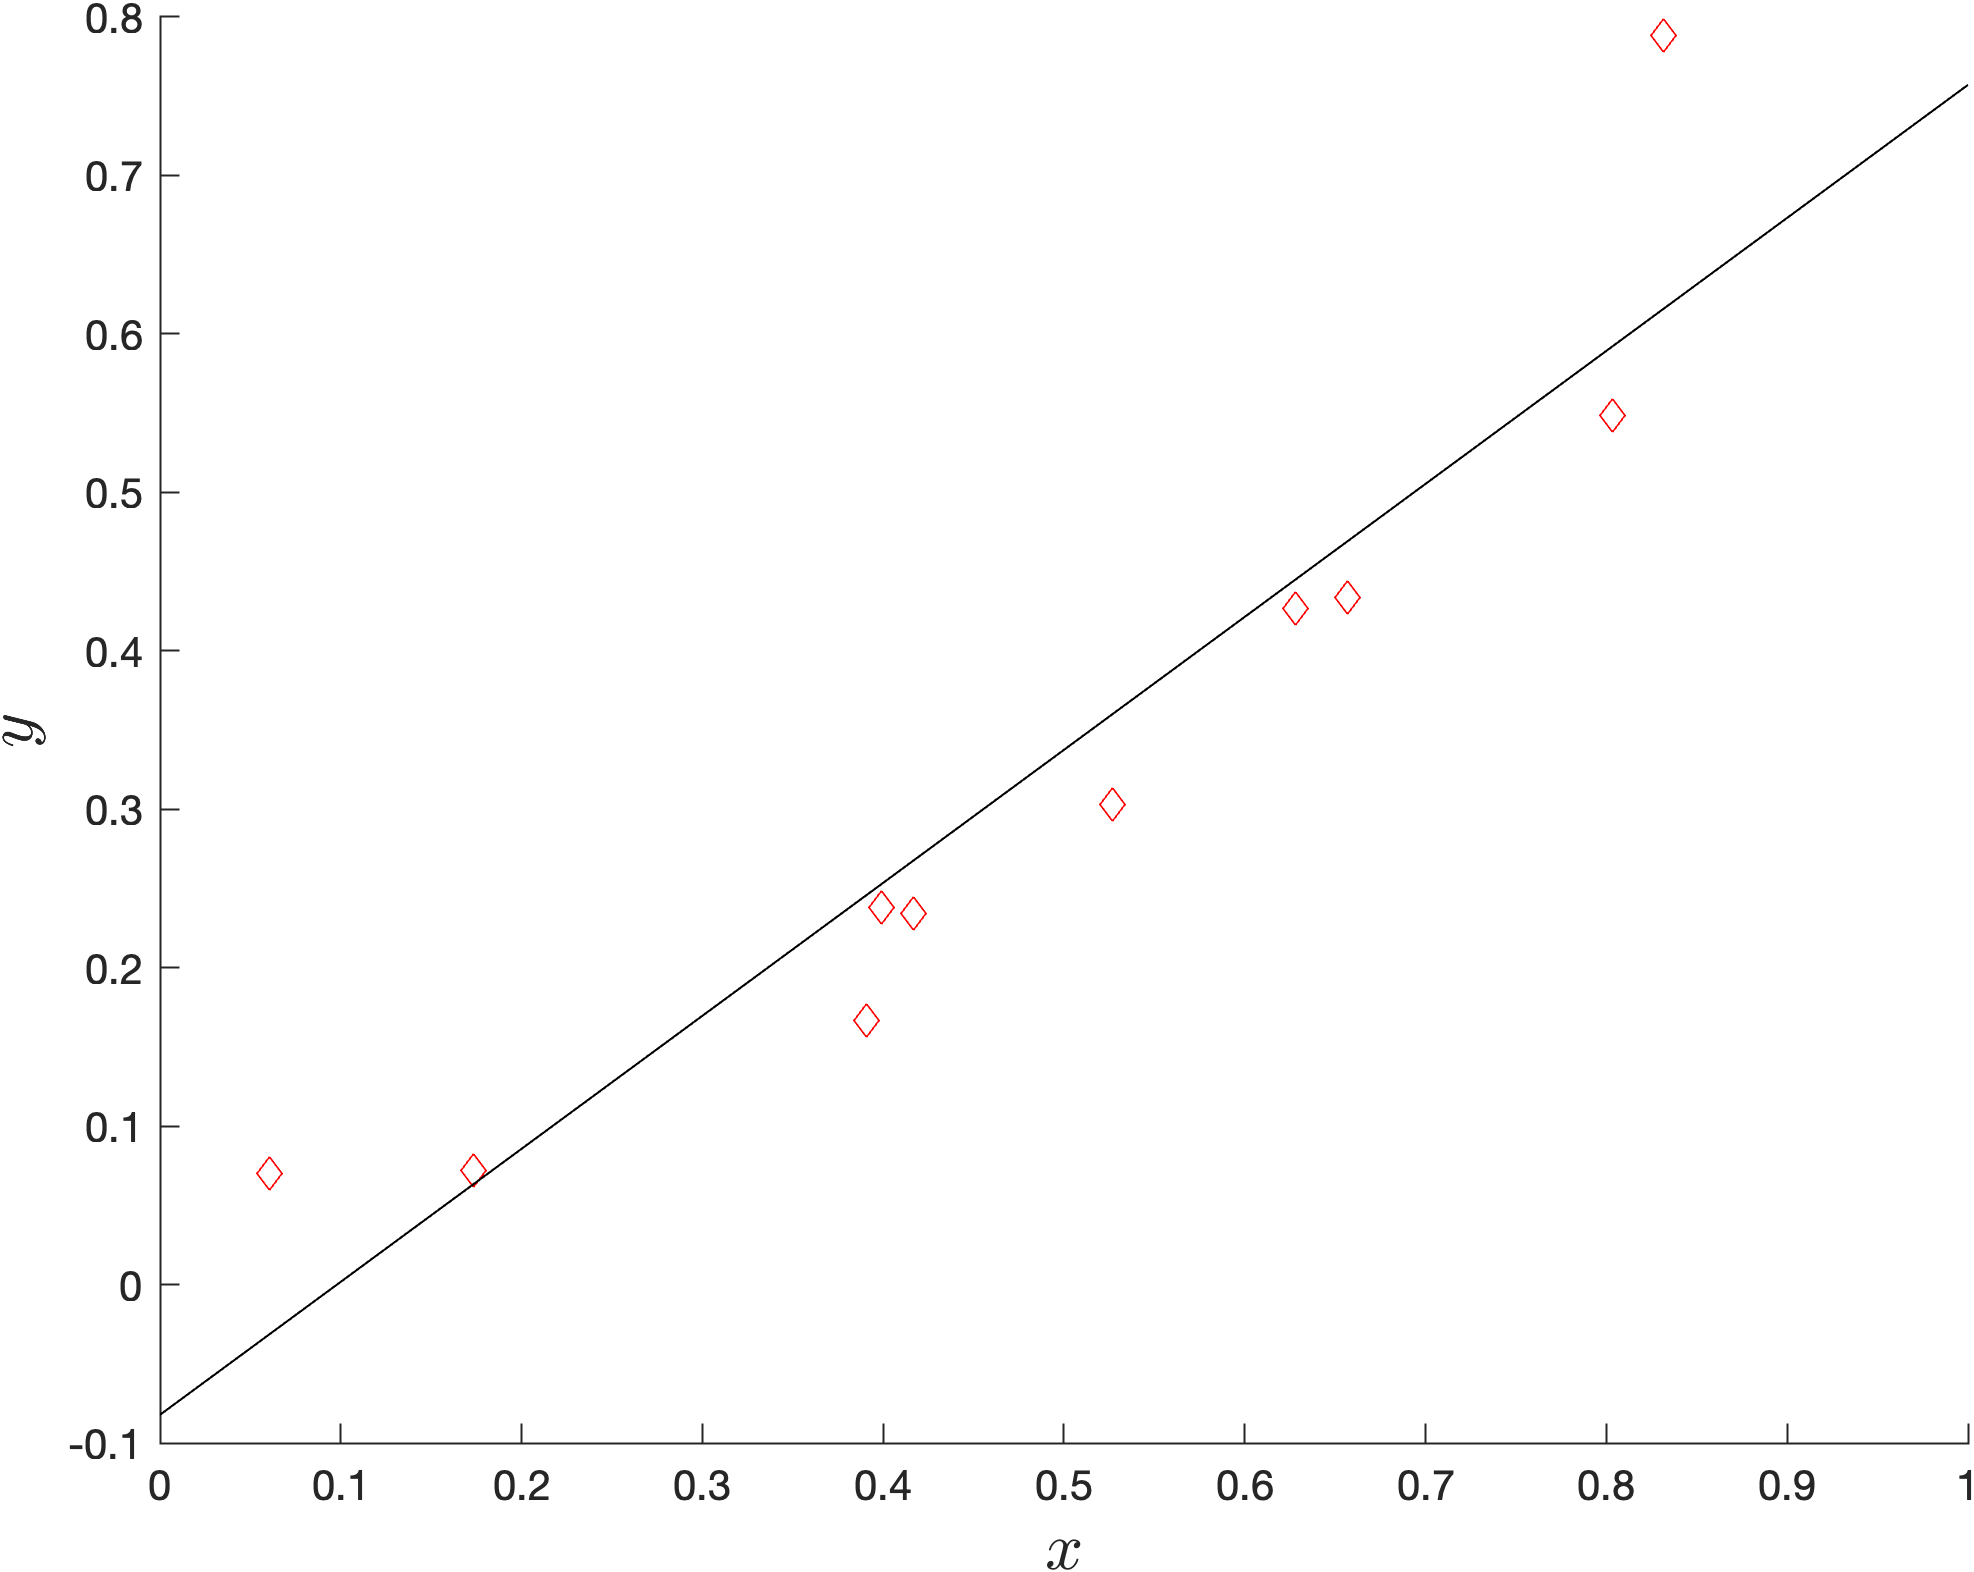
A = ones(length(x), 2);
A(:,1) = x';
fit = A \ y';

hold on
plot([0, 1], [fit(2), fit(1) + fit(2)], 'k')
hold off
Plot
Solution to Exercise 13.7
% -------------------------------------------------------------------------
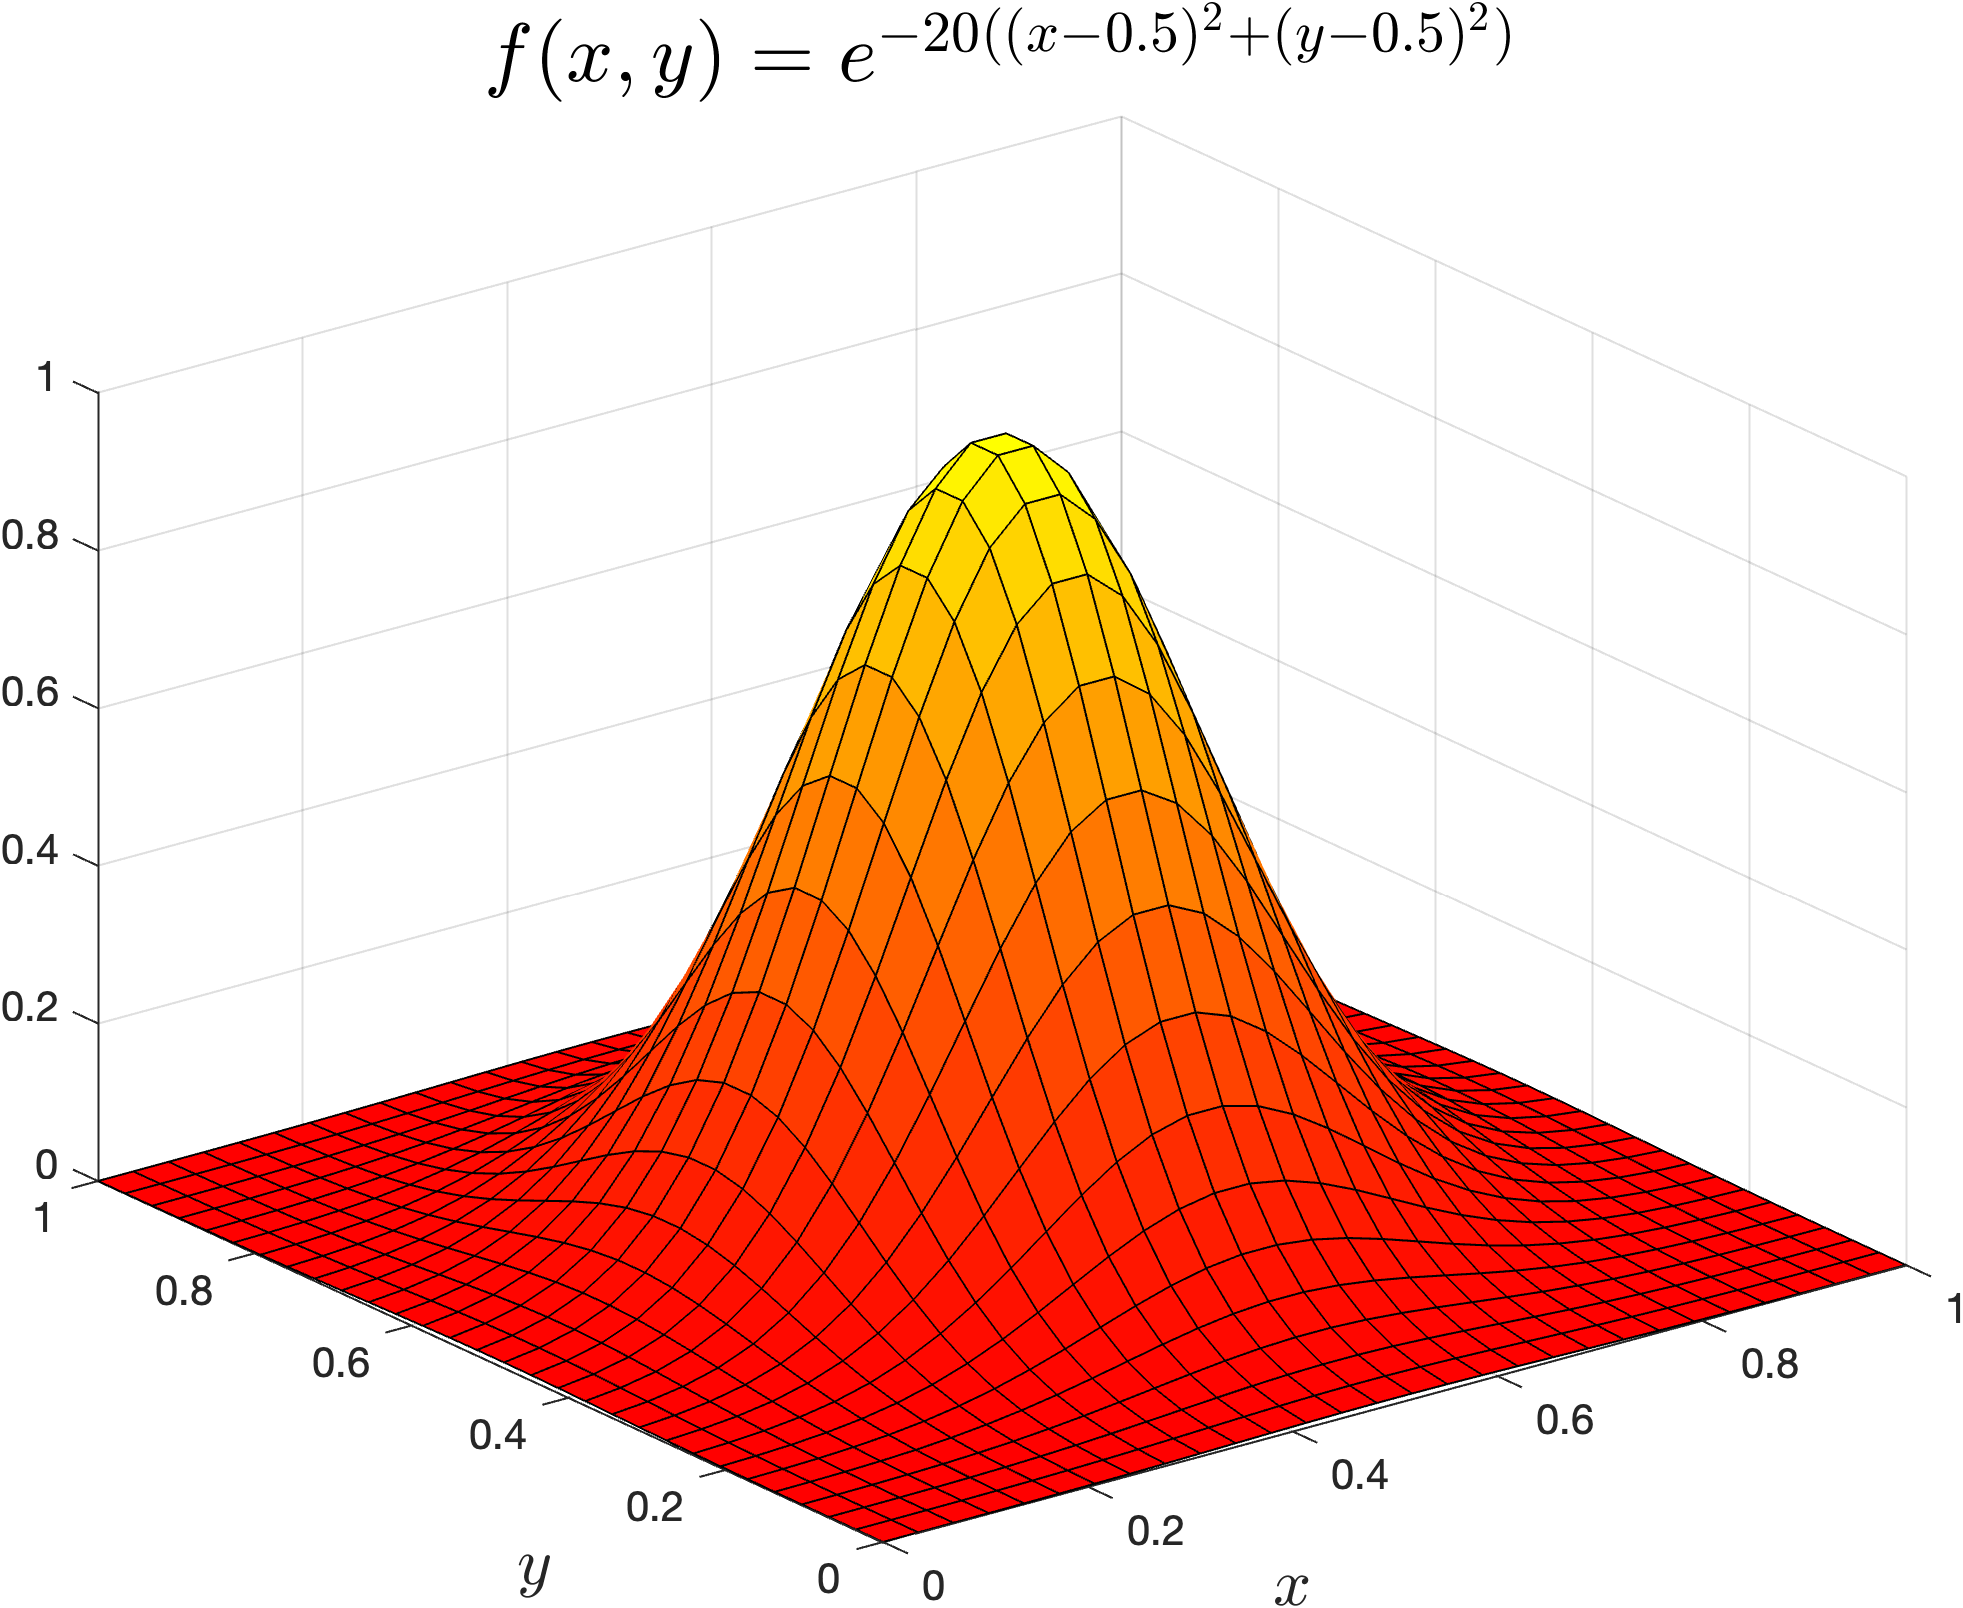
% Exercise 13.7
x = linspace(0, 1, 30);
y = linspace(0, 1, 30);
[X, Y] = meshgrid(x, y);
Z = exp(-20 * ((X - 0.5) .^ 2 + (Y - 0.5) .^2));

clf
surf(X, Y, Z)
xlabel('$x$', 'FontSize', 16, 'Interpreter','latex');
ylabel('$y$', 'FontSize', 16, 'Interpreter','latex');
title('$f(x,y) = e^{-20((x - 0.5)^2 + (y - 0.5)^2)}$', FontSize=20, Interpreter='latex')
colormap(autumn)
Plot
Solution to
% -------------------------------------------------------------------------
% Exercise 13.8
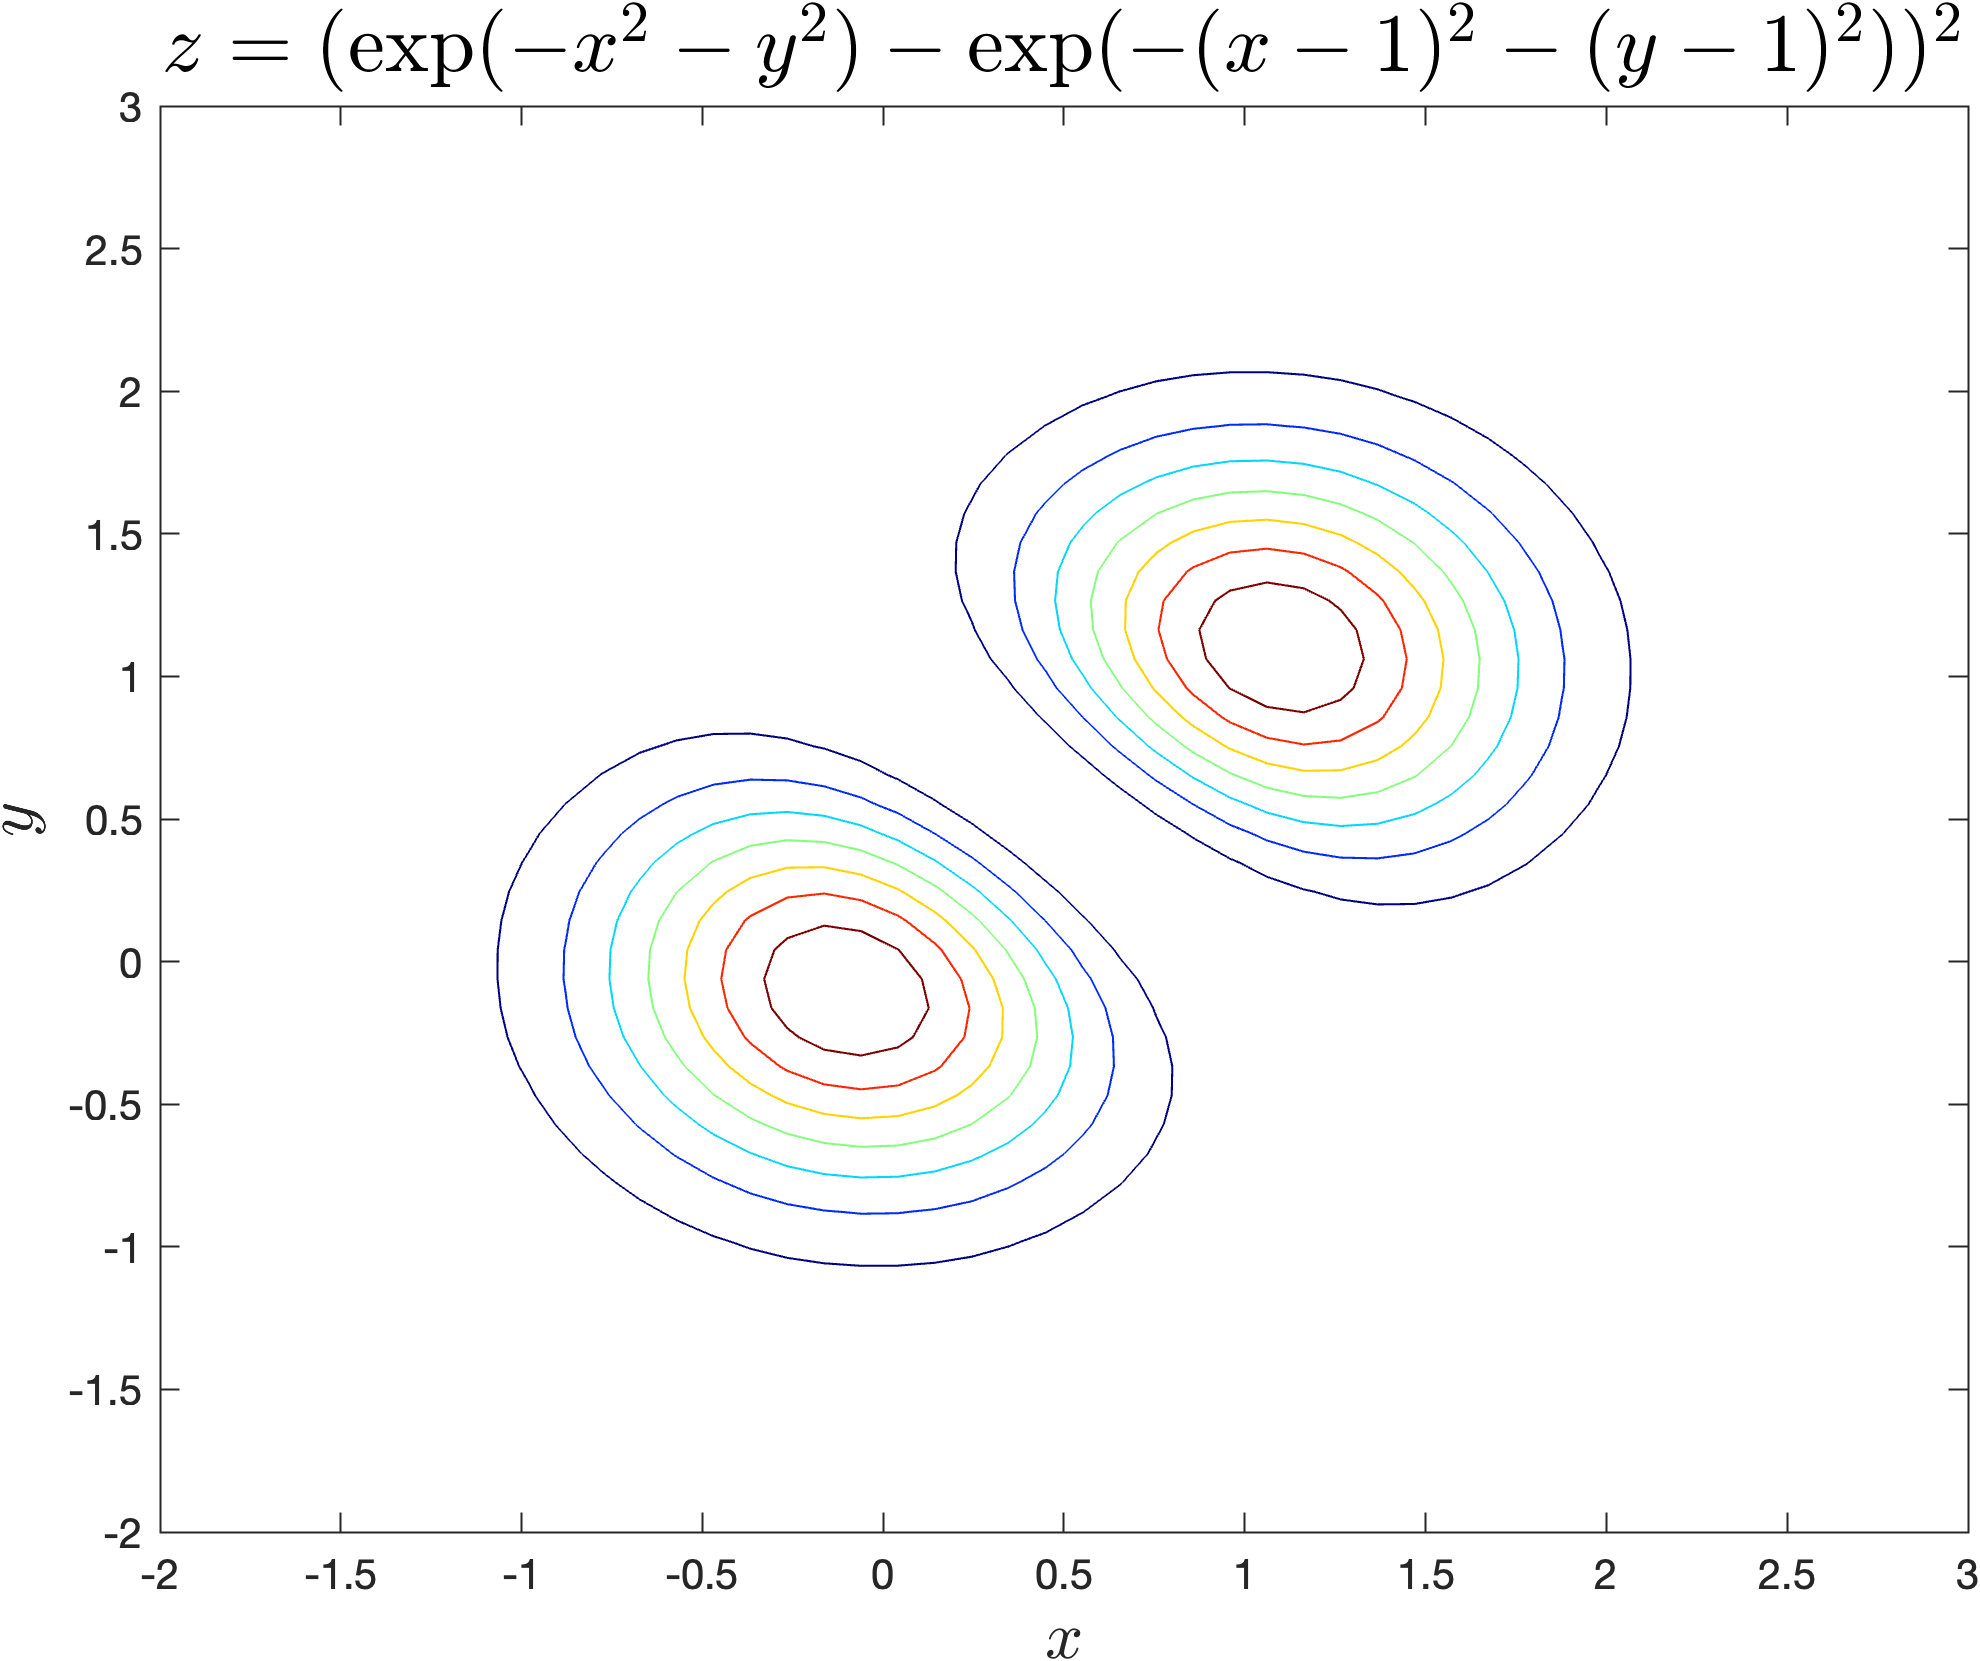
x = linspace(-2, 3, 50);
y = linspace(-2, 3, 50);
[X, Y] = meshgrid(x, y);
Z1 = exp(-X .^ 2 - Y .^ 2);
Z2 = exp(-(X - 1) .^ 2 - (Y - 1) .^ 2);
Z = (Z1 - Z2) .^ 2;

clf
contour(X, Y, Z)
colormap(jet)
xlabel('$x$', 'FontSize', 16, 'Interpreter','latex');
ylabel('$y$', 'FontSize', 16, 'Interpreter','latex');
title('$z = (\exp(-x^2 - y^2) - \exp(-(x - 1)^2 - (y - 1)^2))^2$', FontSize=20, Interpreter='latex')
Plot
Solution to
% -------------------------------------------------------------------------
% Exercise 13.9
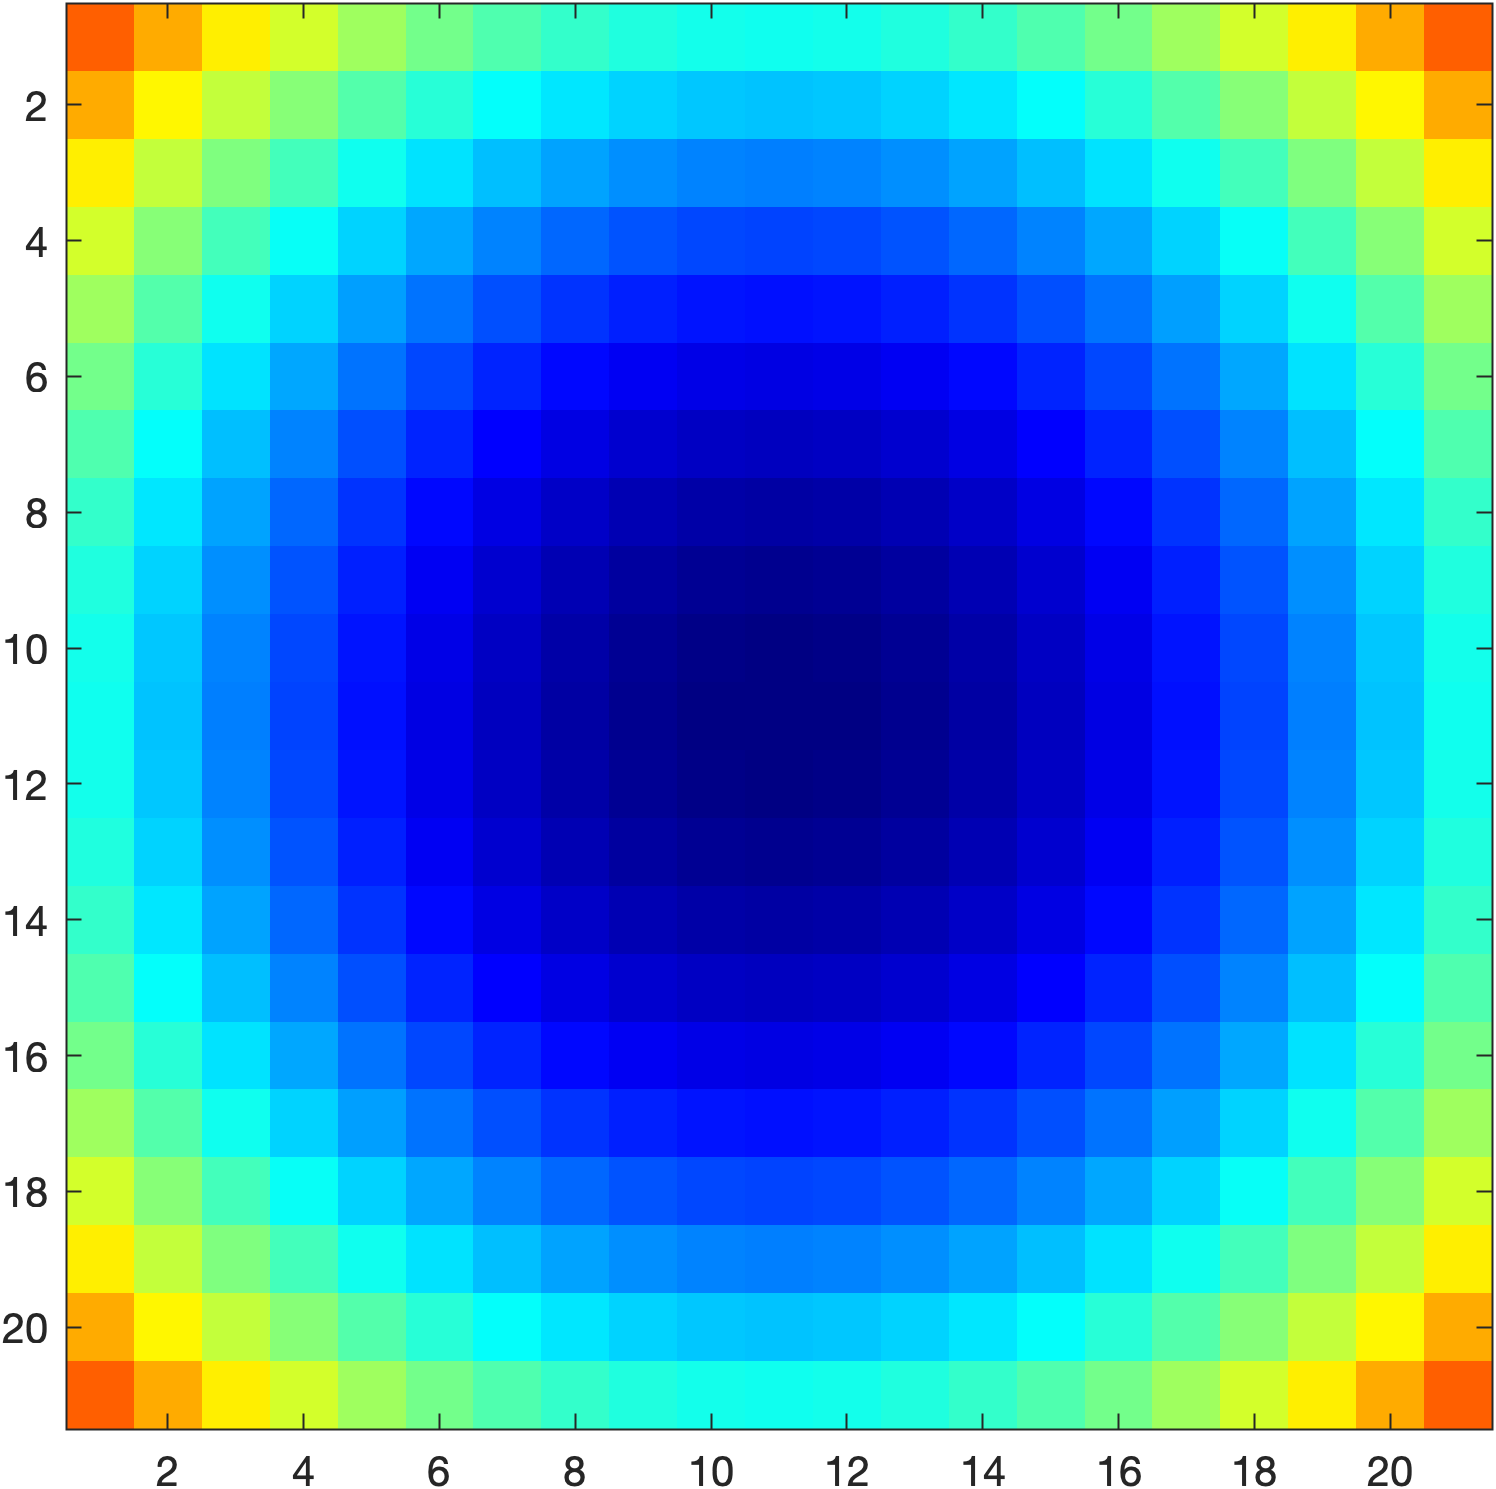
img = zeros(21);
for i = 1 : 21
    for j = 1 : 21
        img(i, j) = (i - 11) ^ 2 + (j - 11) ^ 2;
    end
end

image(img)
axis equal tight
colormap(jet)
Plot
Solution to
% -------------------------------------------------------------------------
% Exercise 13.10
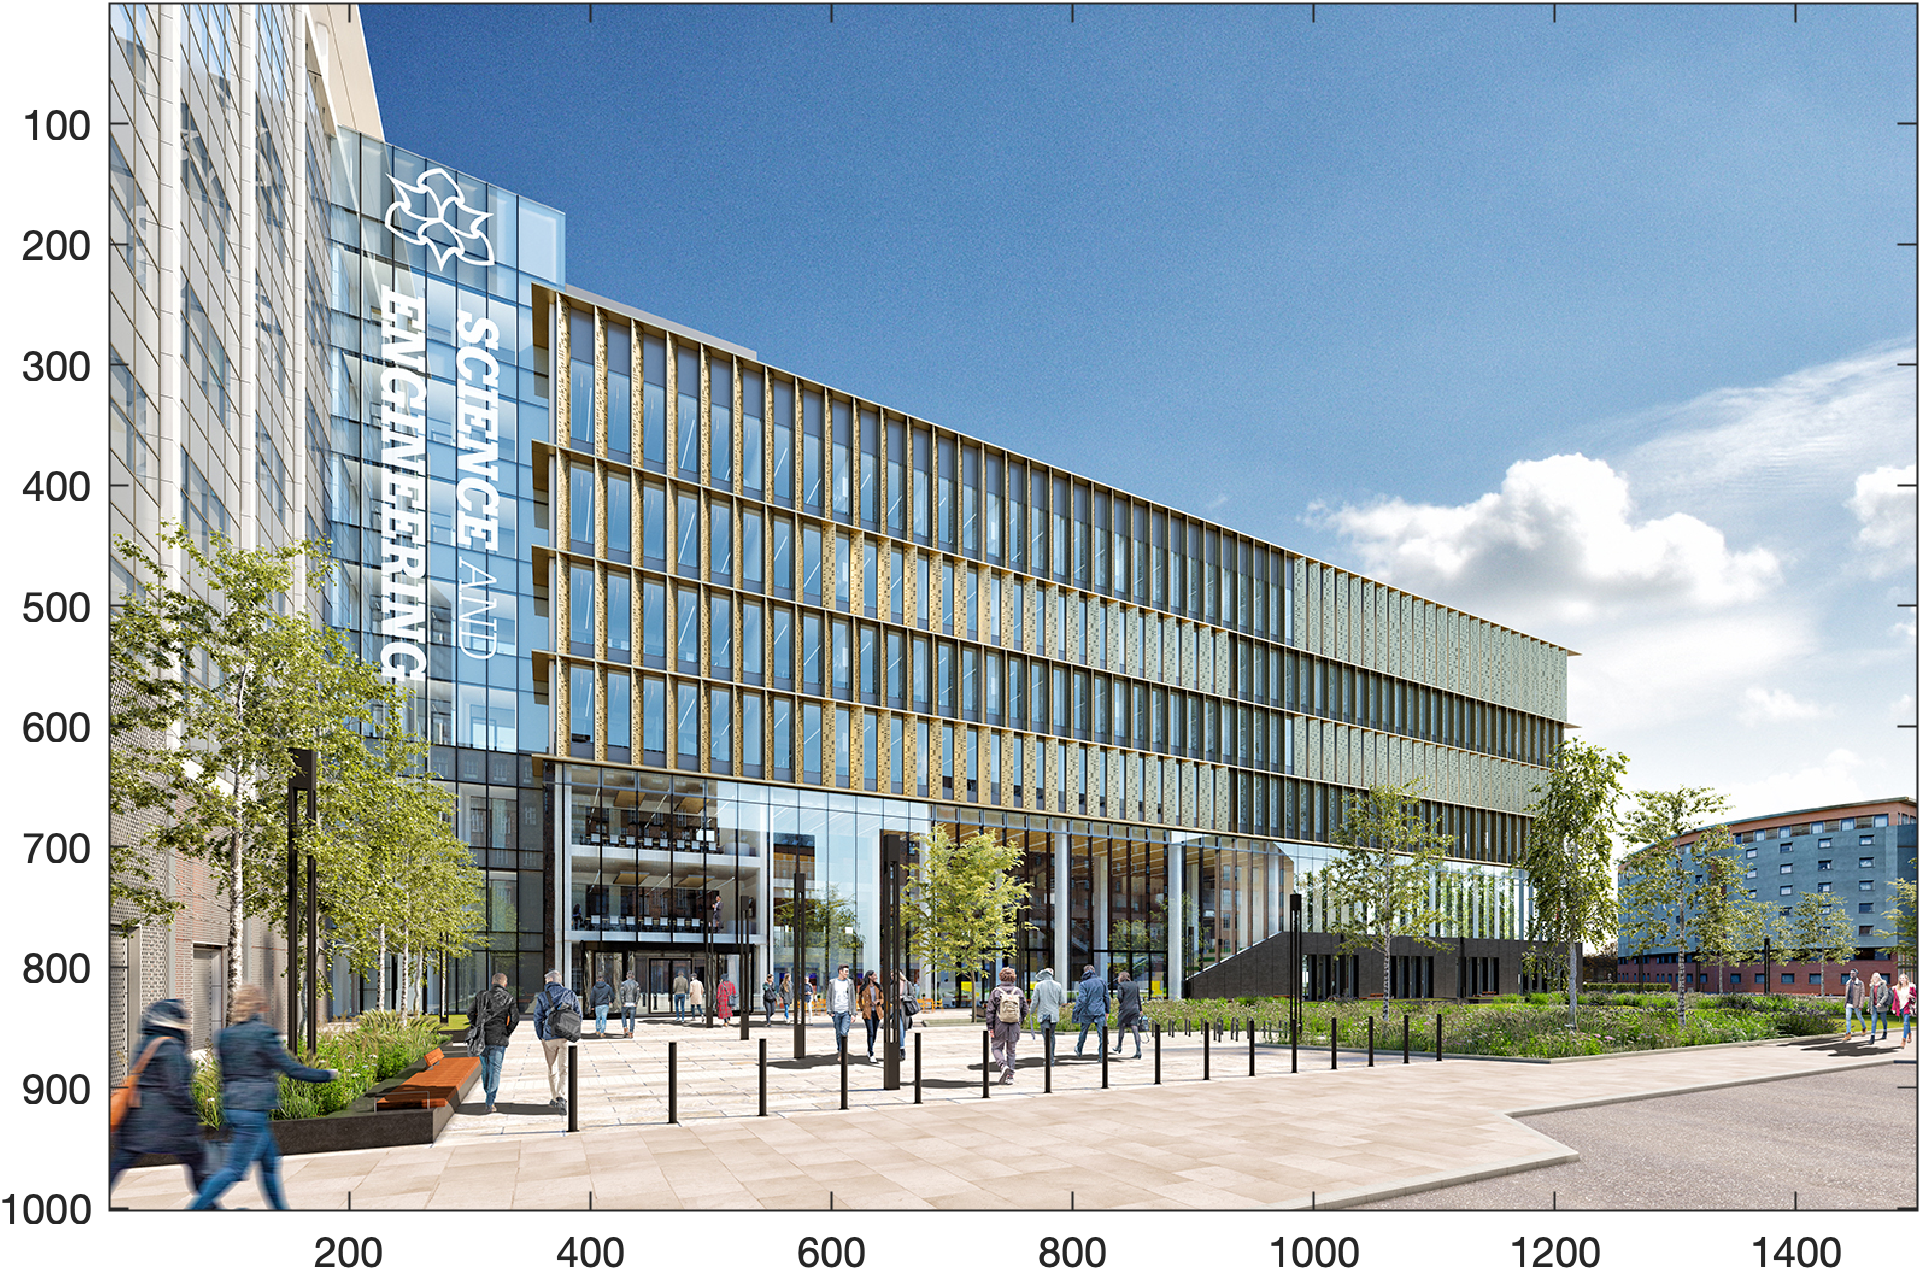
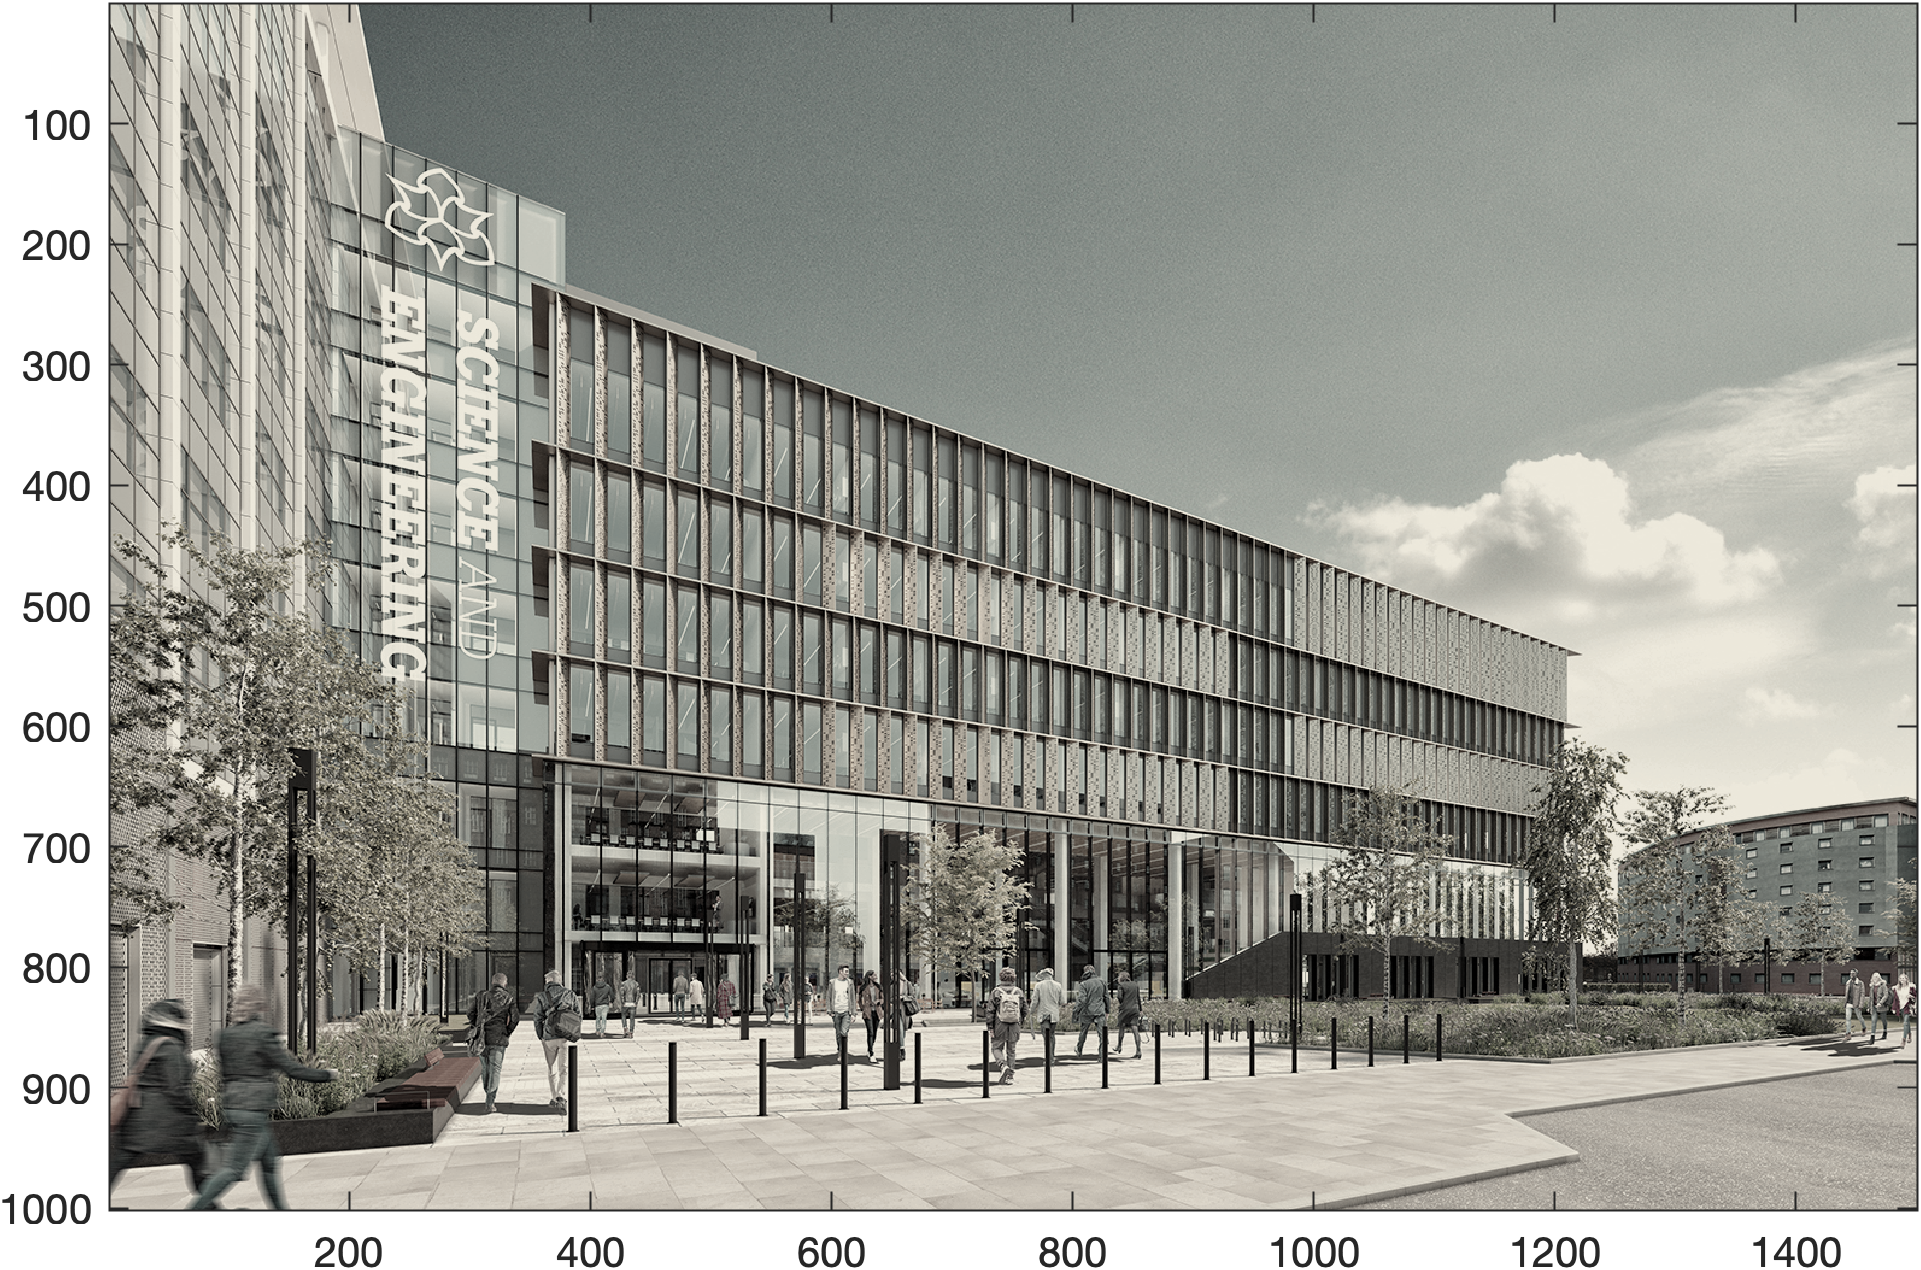
img = imread('Dalton_building.jpg');

% Determine the size of the image in pixels
[height, width, colours] = size(img);
fprintf('\nwidth       : %i\n', width)
fprintf('height      : %i\n', height)
fprintf('no. colours : %i\n', colours)

% Plot the image
image(img)
axis equal tight
Plot
