6.8. Exercise Solutions#
Solution to Exercise 6.1
import numpy as np
import matplotlib.pyplot as plt

# Exercise 6.1
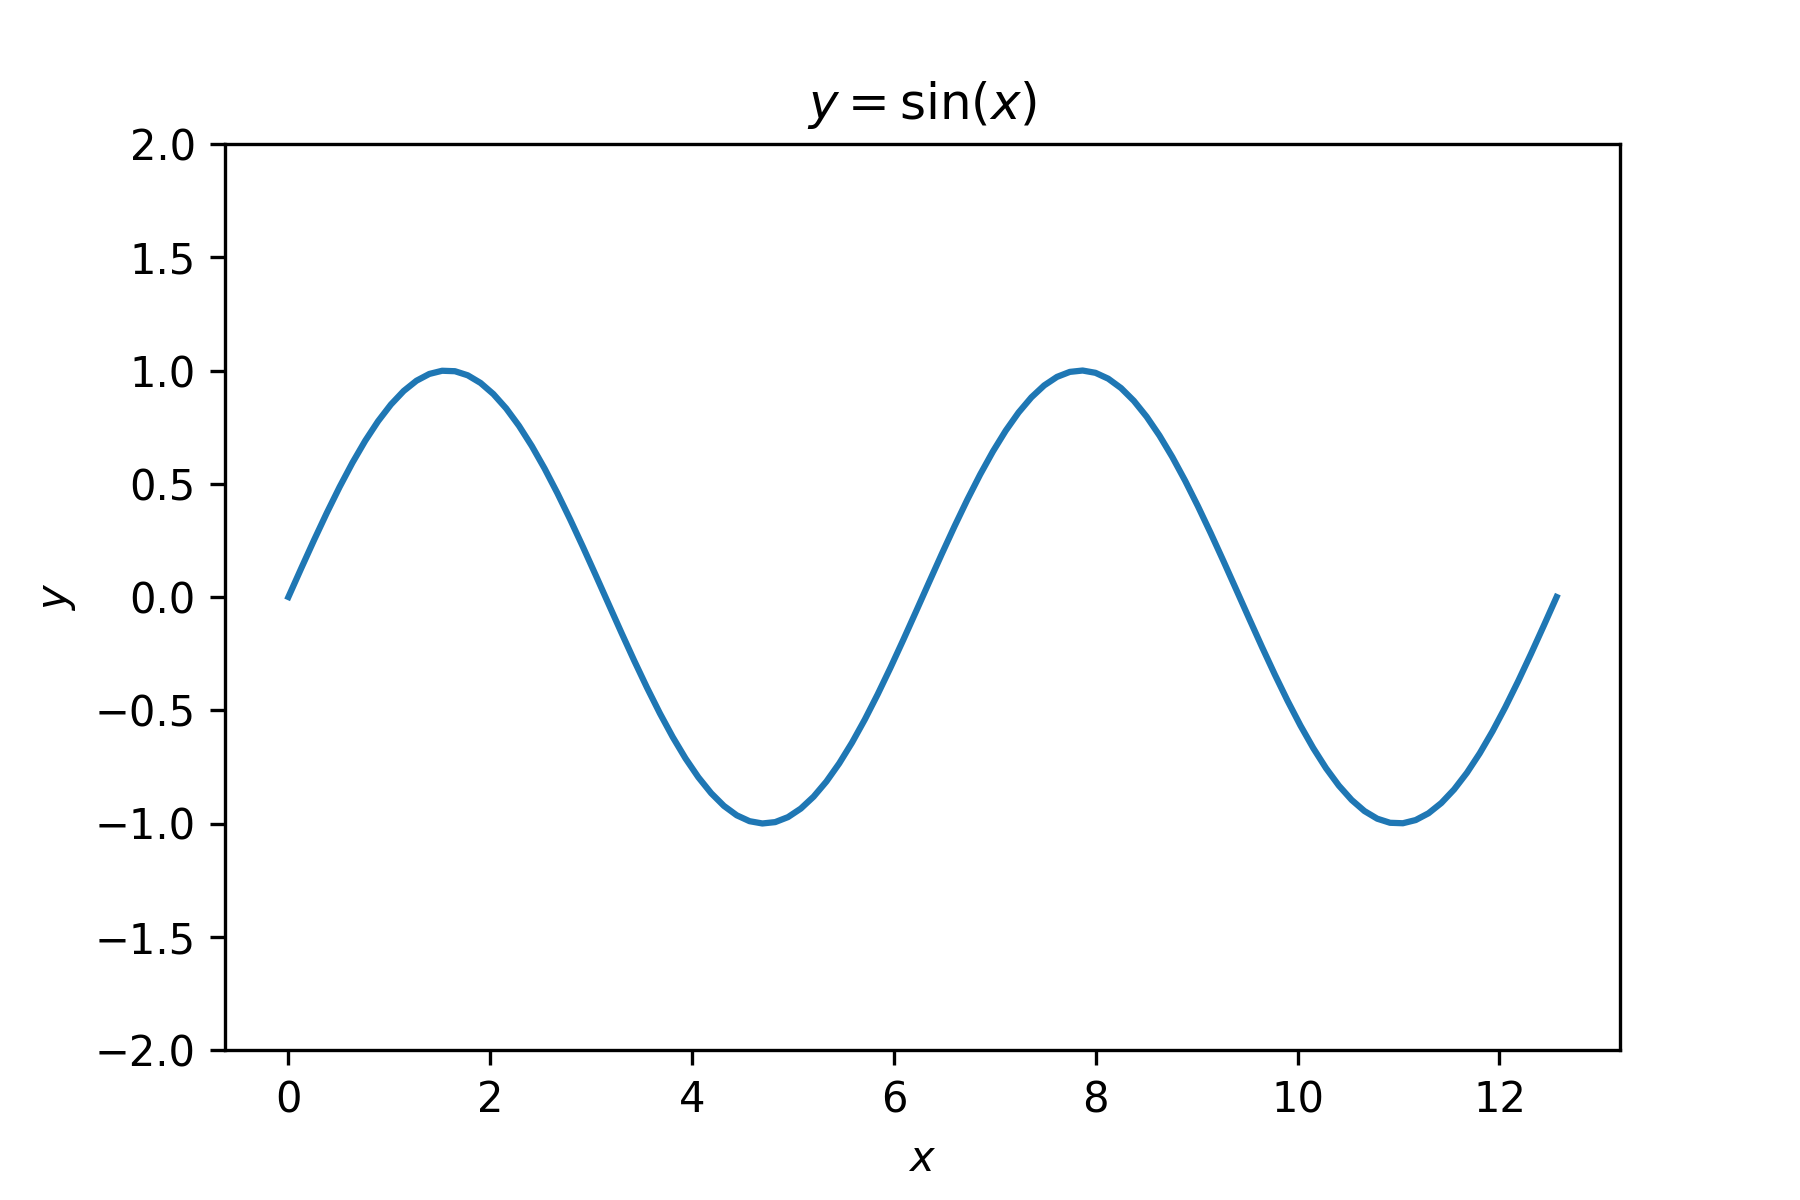
x = np.linspace(0, 4 * np.pi, 100)
y = np.sin(x)

fig, ax = plt.subplots()
plt.plot(x, y)
plt.ylim(-2, 2)
plt.xlabel('$x$')
plt.ylabel('$y$')
plt.title('$y = \sin(x)$')
plt.show()
Output
Solution to Exercise 6.2
# Exercise 6.2
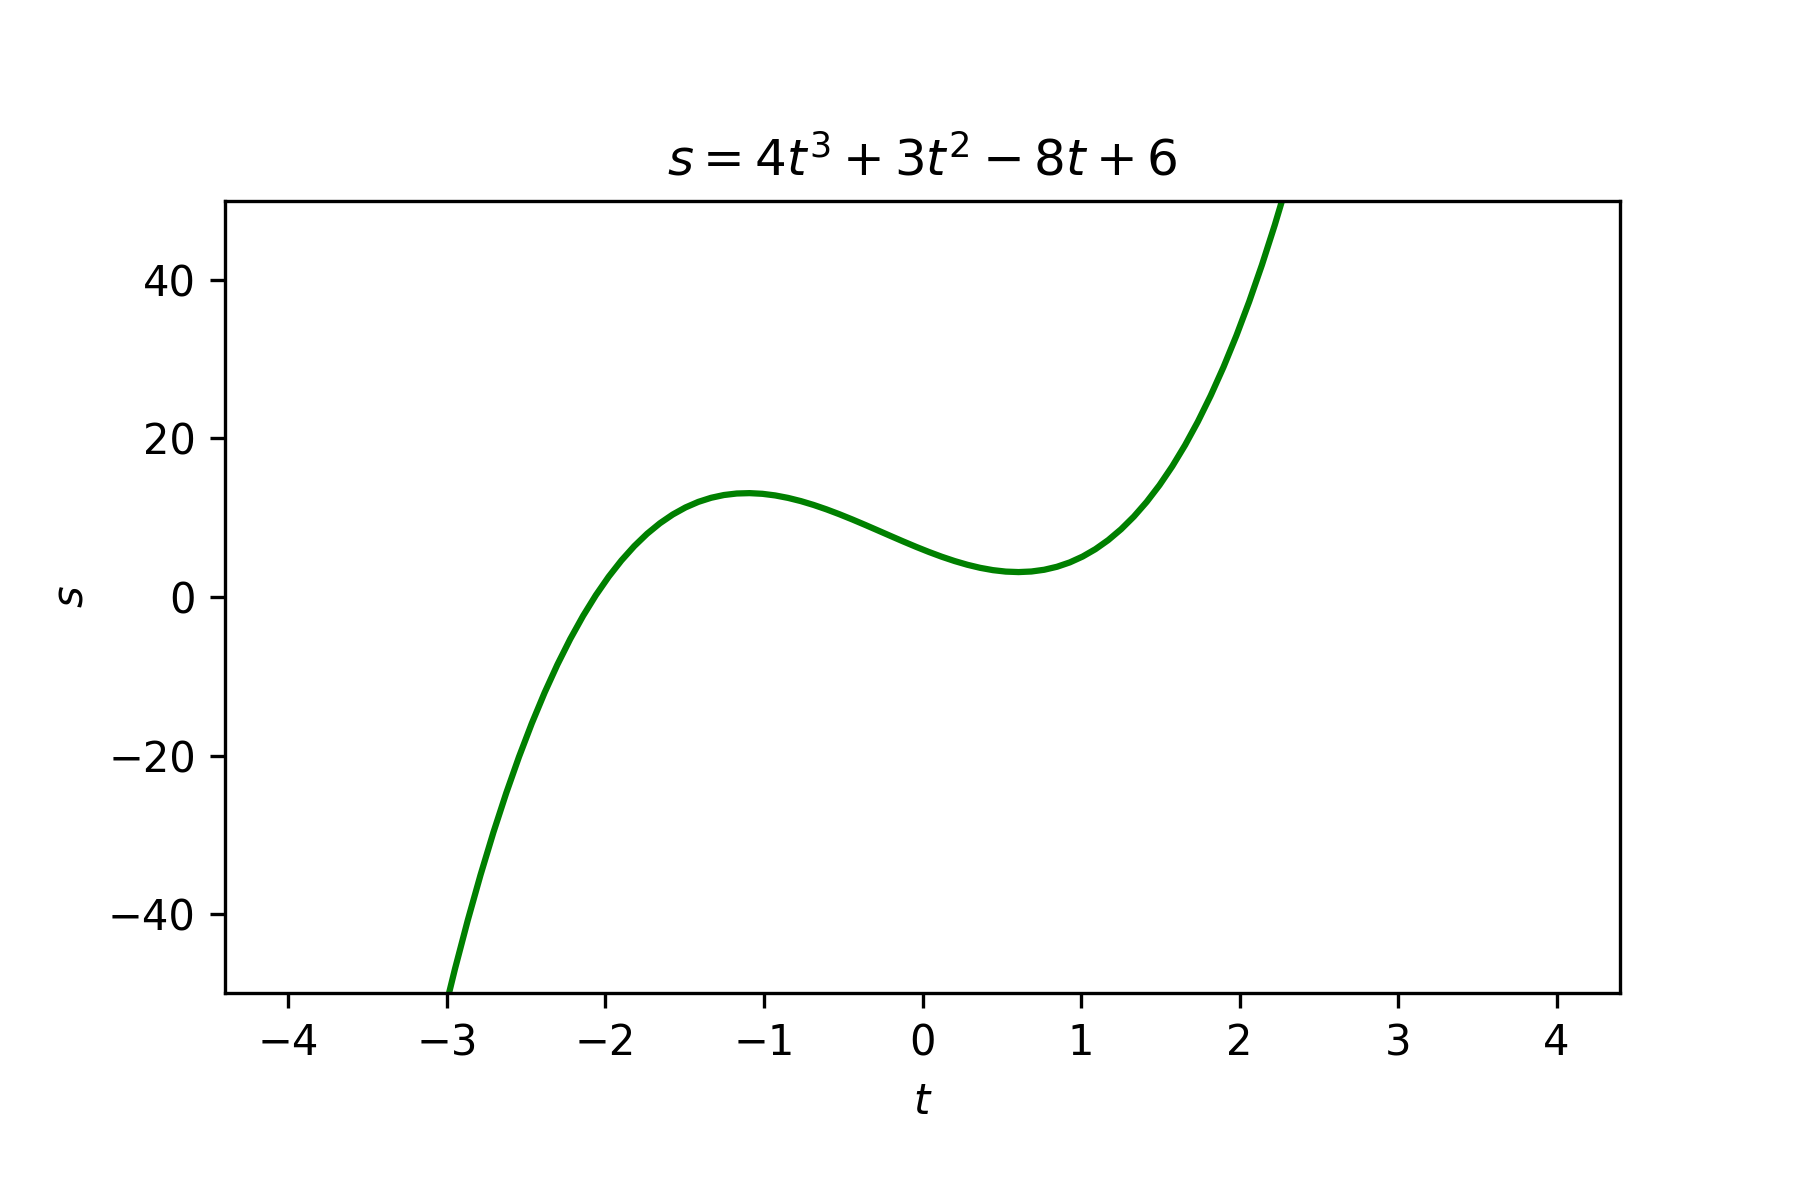
t = np.linspace(-4, 4, 100)
s = 4 * t ** 3 + 3 * t ** 2 - 8 * t + 6

fig, ax = plt.subplots()
plt.plot(t, s, 'g-')
plt.xlabel('$t$')
plt.ylabel('$s$')
plt.title('$s = 4t^3 + 3t^2 - 8t + 6$')
plt.ylim(-50, 50)
plt.gca().set_aspect(0.05)
plt.show()
Output
Solution to Exercise 6.3
# Exercise 6.3
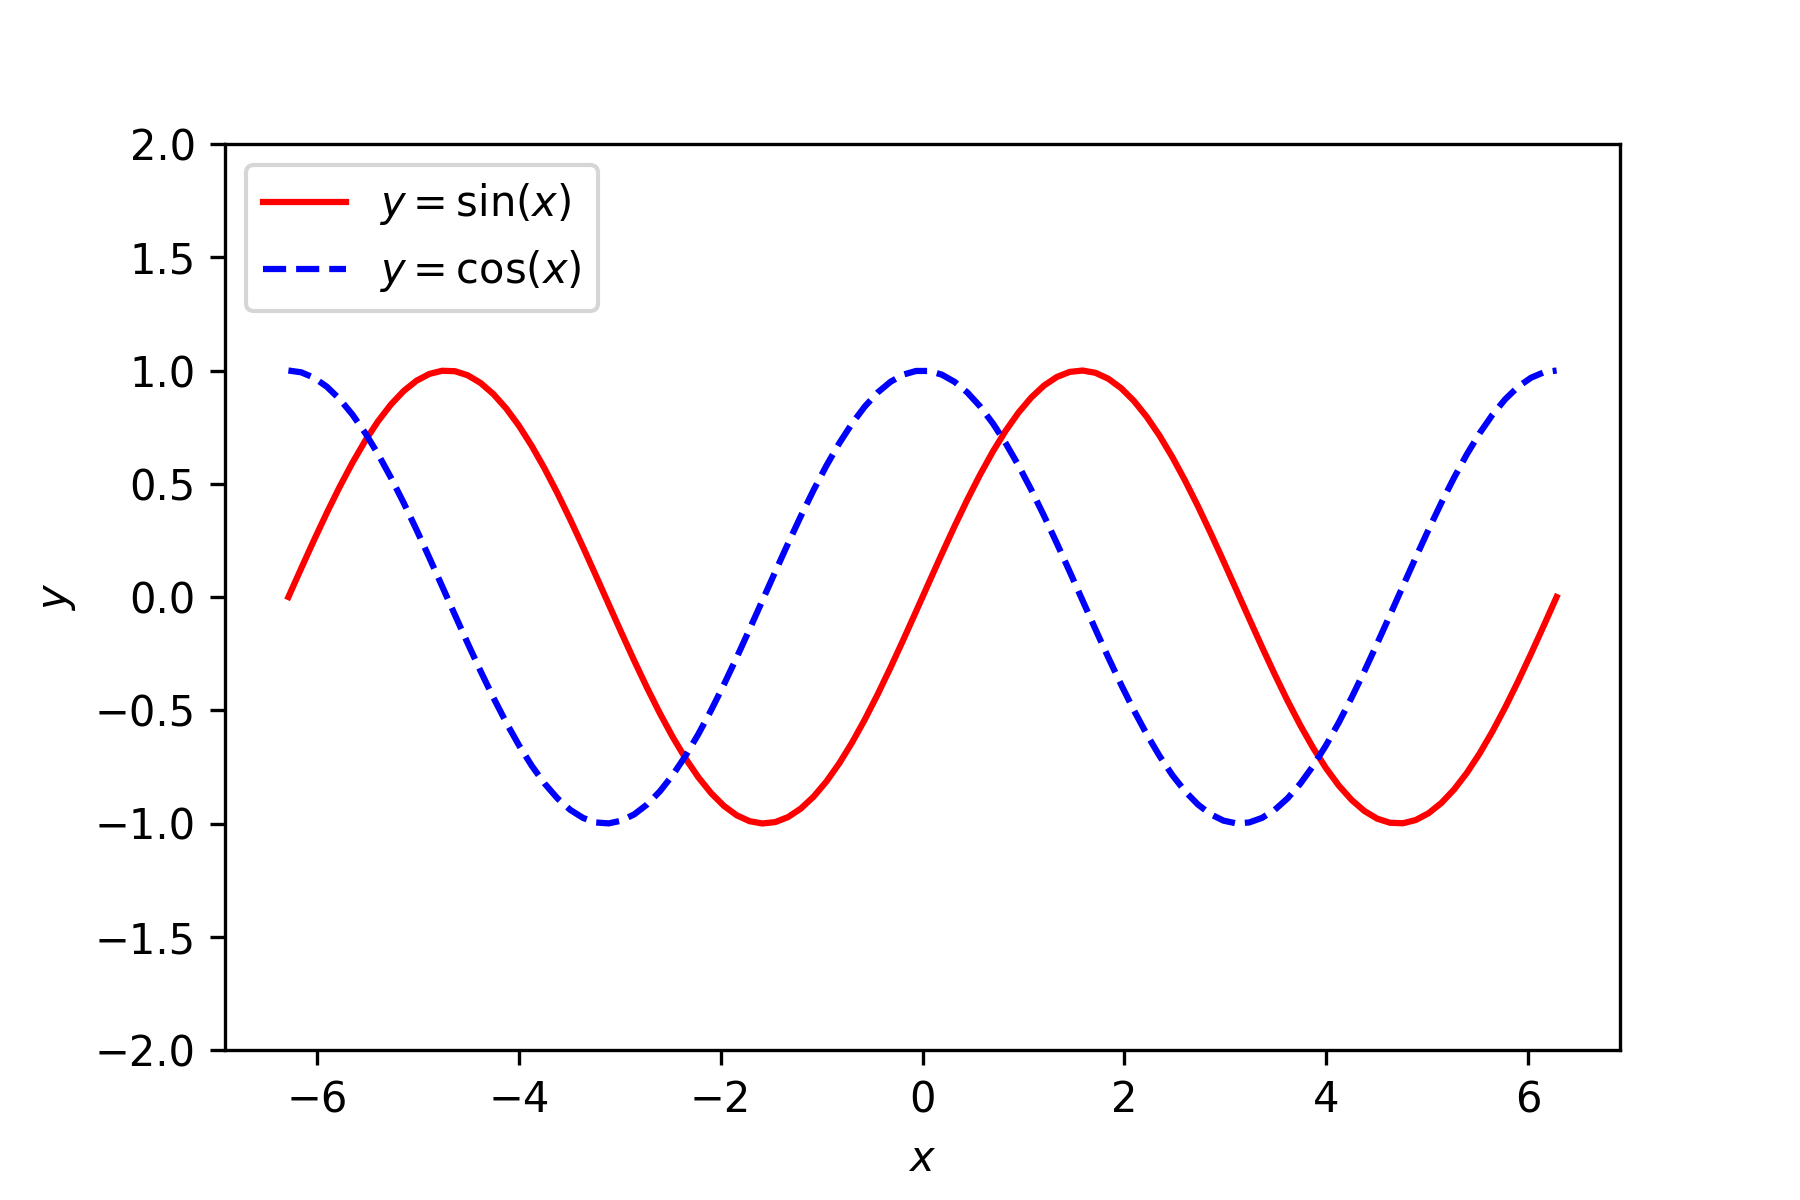
x = np.linspace(-2 * np.pi, 2 * np.pi, 100)
sinx = np.sin(x)
cosx = np.cos(x)

fig, ax = plt.subplots()
plt.plot(x, sinx, 'r', label='$y = \sin(x)$')
plt.plot(x, cosx, 'b--', label = '$y = \cos(x)$')
plt.xlabel('$x$')
plt.ylabel('$y$')
plt.ylim(-2, 2)
plt.legend(loc='upper left')
plt.show()
Output
Solution to Exercise 6.4
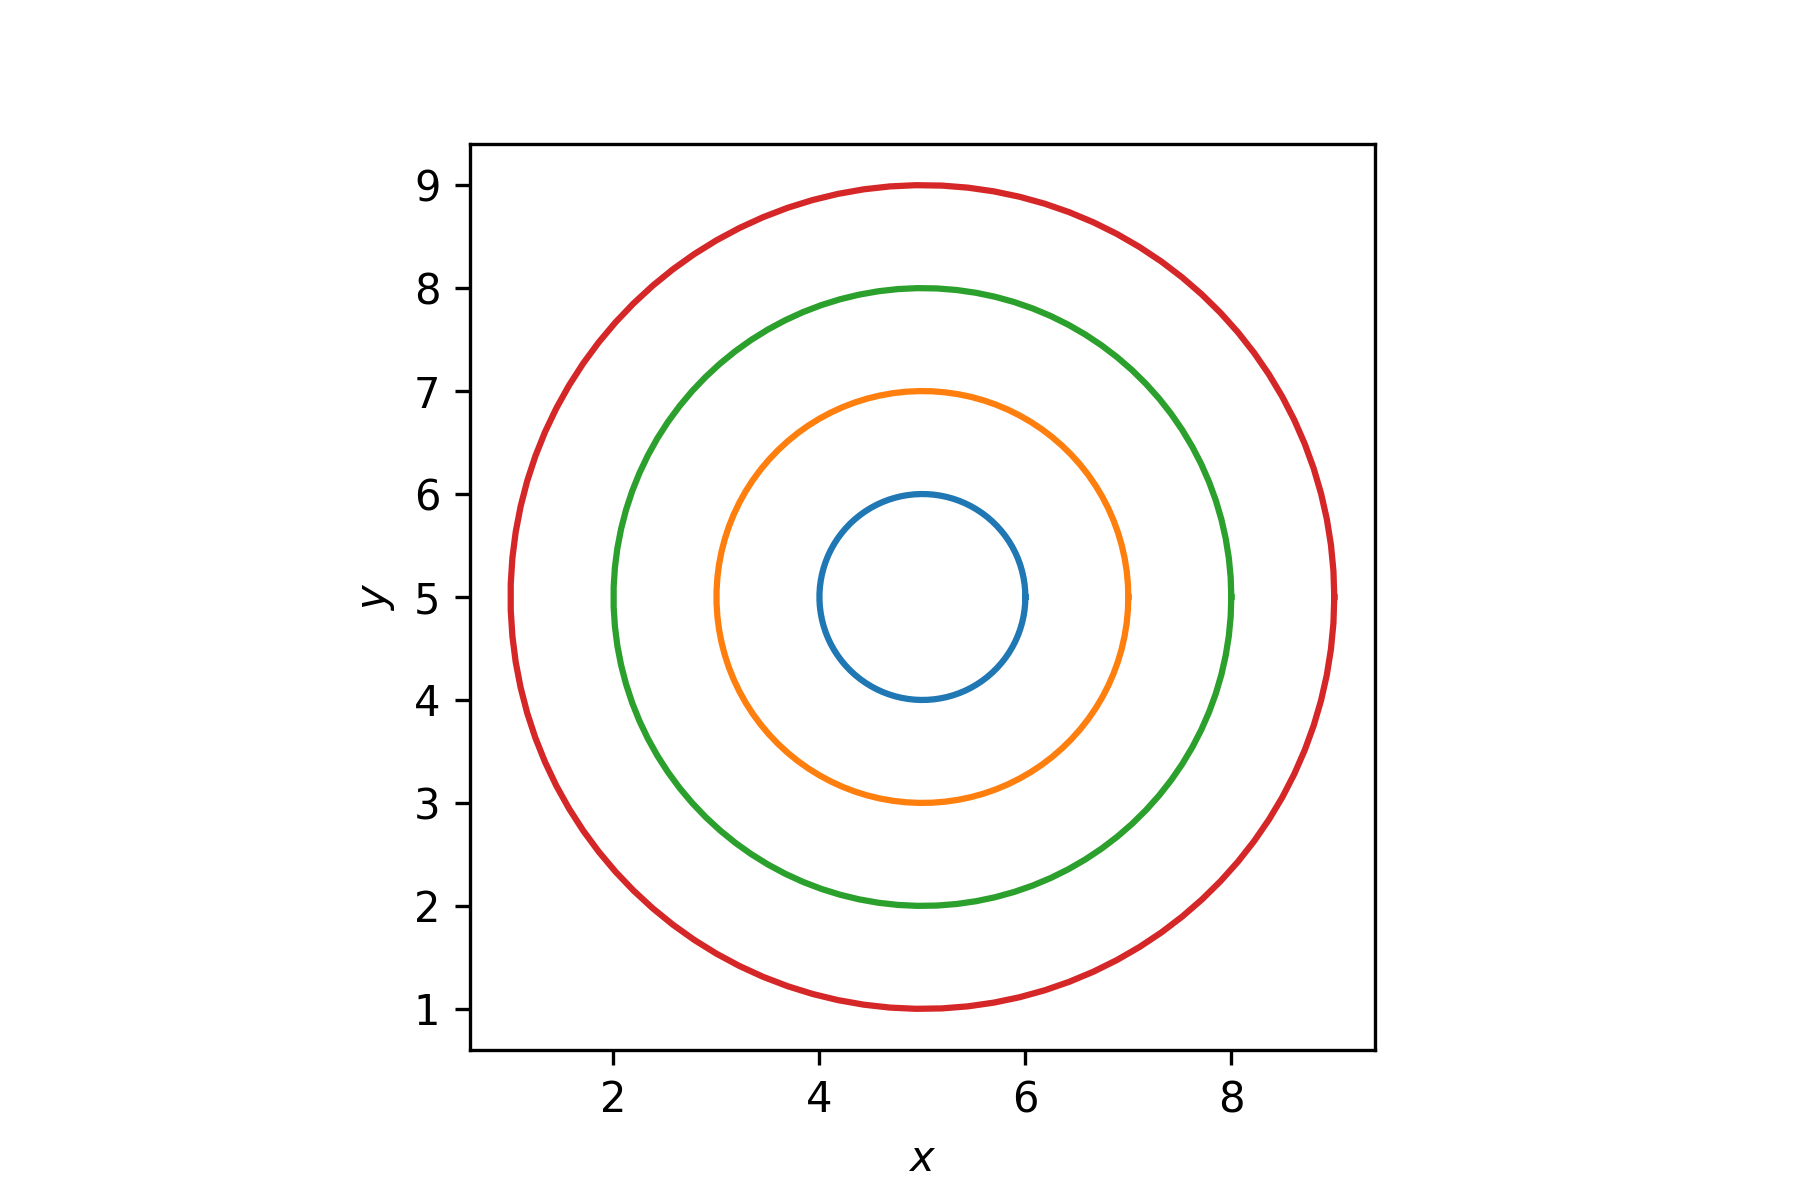
# Exercise 6.4
theta = np.linspace(0, 2 * np.pi, 100)
cx, cy = 5, 5

fig, ax = plt.subplots()
for radius in range(1, 5):
    x = cx + radius * np.cos(theta)
    y = cy + radius * np.sin(theta)
    plt.plot(x, y)

plt.xlabel('$x$')
plt.ylabel('$y$')
plt.gca().set_aspect('equal')
plt.savefig('../_images/6_Exercise_6.4.png', dpi=300)
plt.show()
Output
Solution to Exercise 6.5
# Exercise 6.5
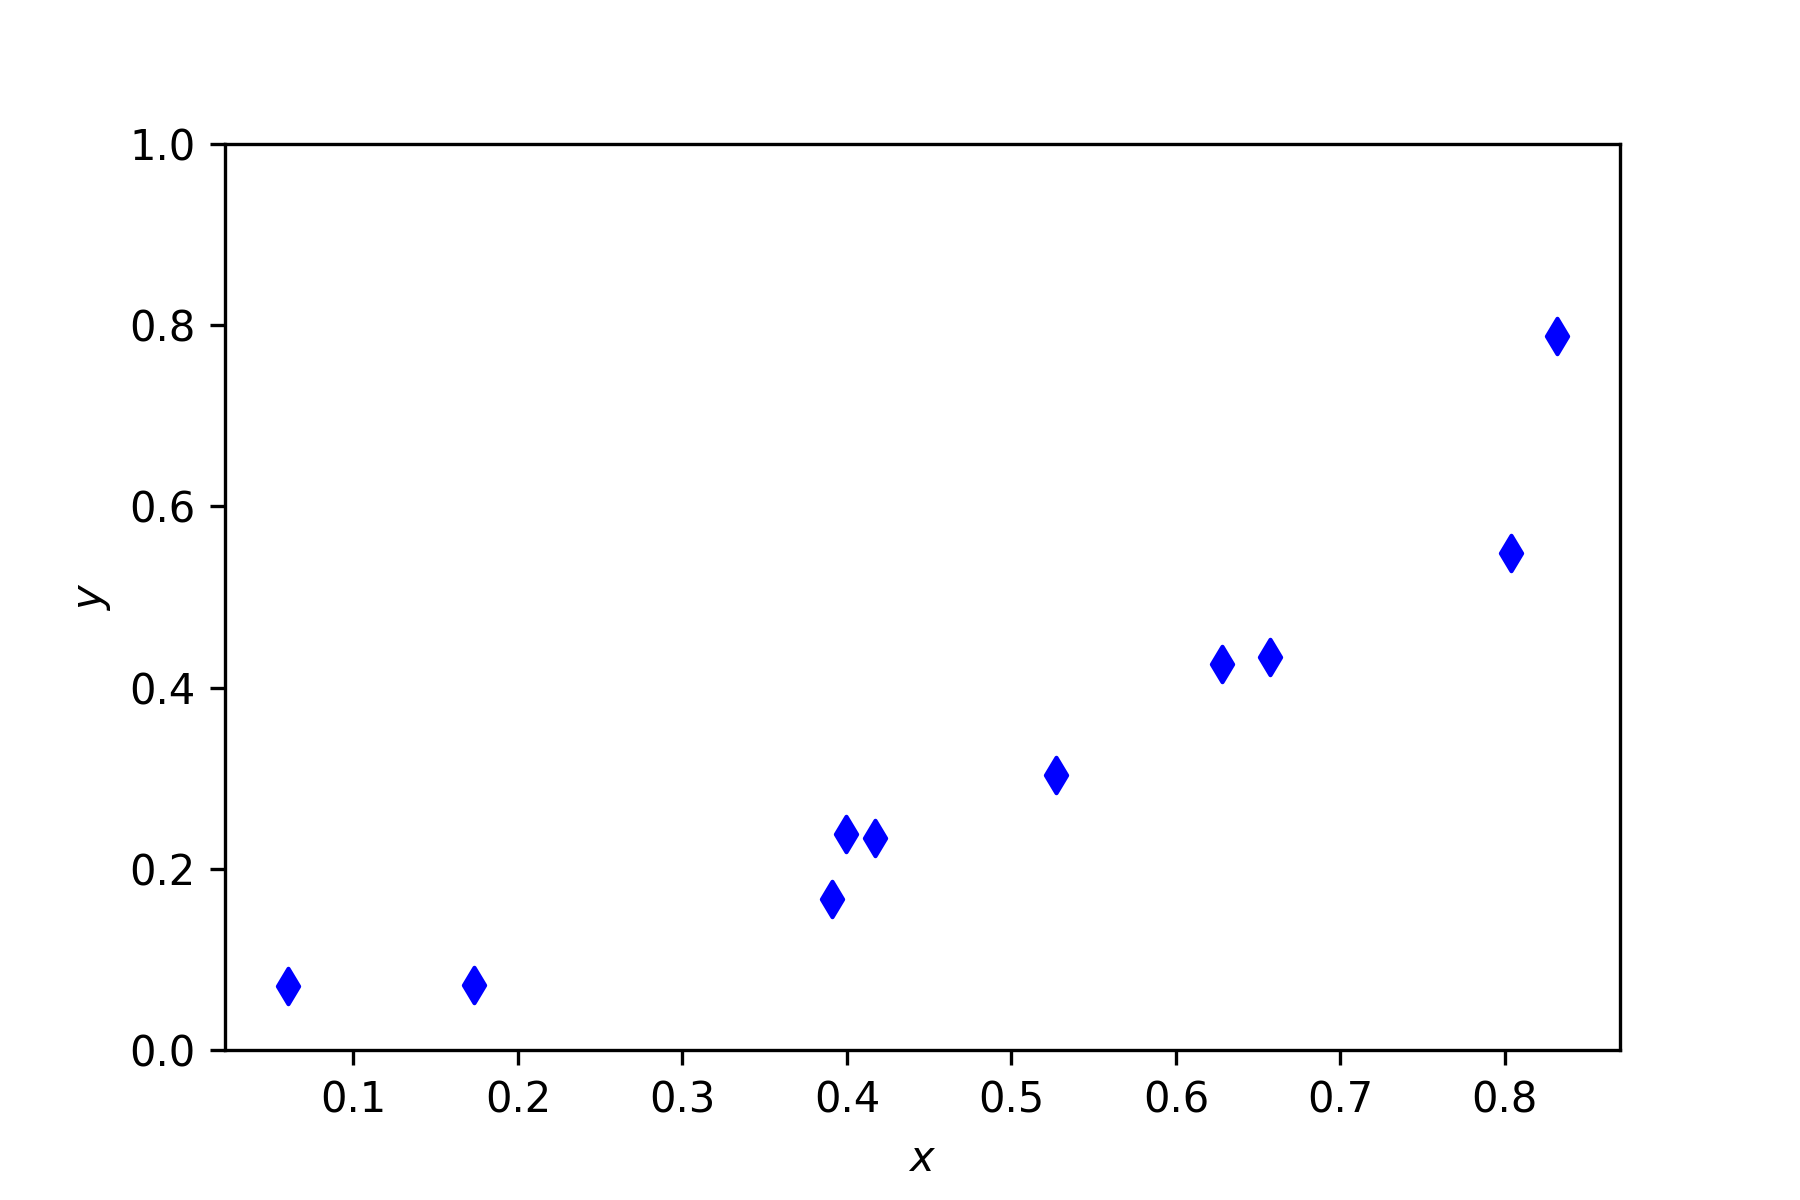
x = np.array([ 0.1734, 0.3909, 0.8314, 0.8034, 0.0605, 0.3993, 0.5269, 0.4168, 0.6569, 0.6280 ])
y = np.array([ 0.0717, 0.1665, 0.7881, 0.5486, 0.0702, 0.2382, 0.3031, 0.2341, 0.4335, 0.4265 ])

fig, ax = plt.subplots()
plt.scatter(x, y, color='blue', marker='d')
plt.xlabel('$x$')
plt.ylabel('$y$')
plt.ylim(0, 1)
plt.show()
Output
Solution to Exercise 6.6
# Exercise 6.6
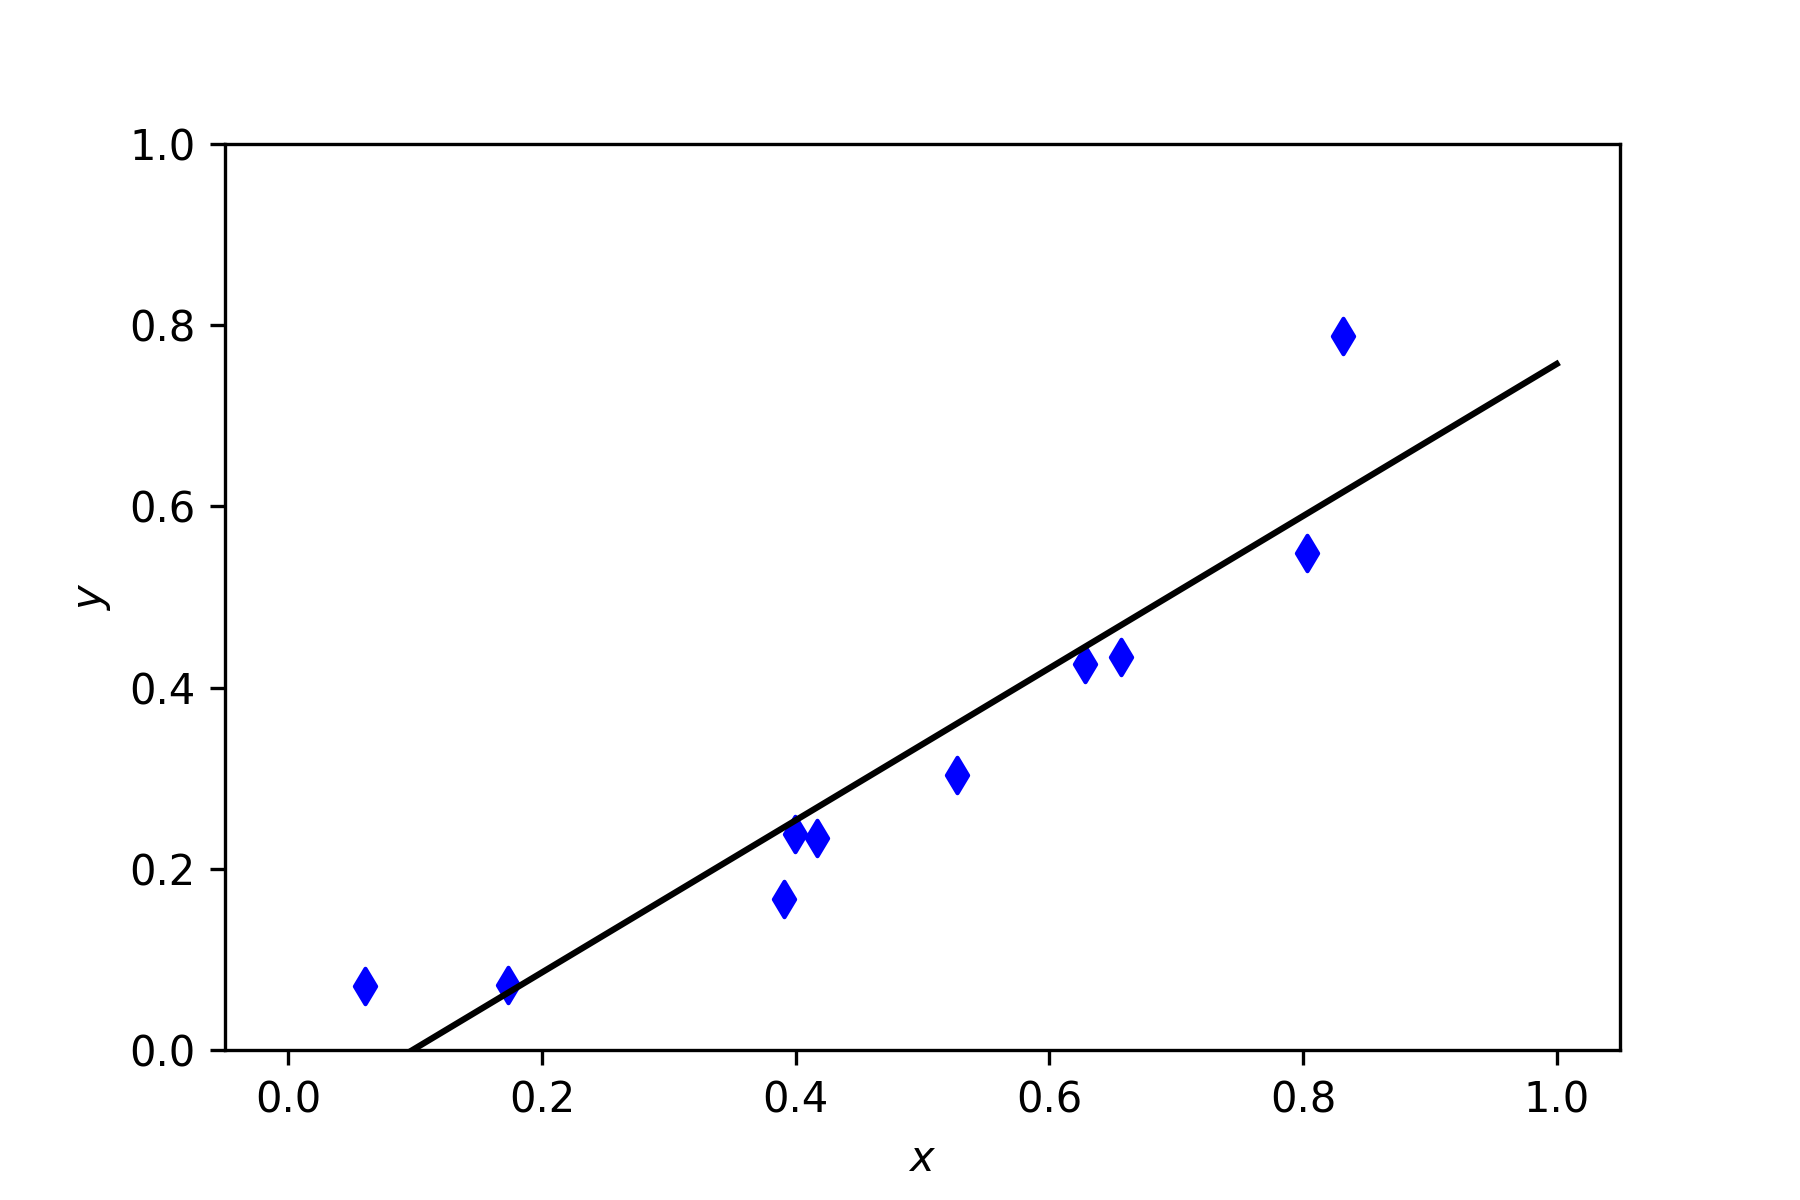
A = np.ones((len(x), 2))
A[:,0] = x
m, c = np.linalg.lstsq(A, y, rcond=None)[0]
x1 = np.array([0, 1])
y1 = m * x1 + c

fig, ax = plt.subplots()
plt.scatter(x, y, color='blue', marker='d')
plt.plot(x1, y1, 'k')
plt.xlabel('$x$')
plt.ylabel('$y$')
plt.ylim(0, 1)
plt.show()
Output
Solution to Exercise 6.7
# Exercise 6.7
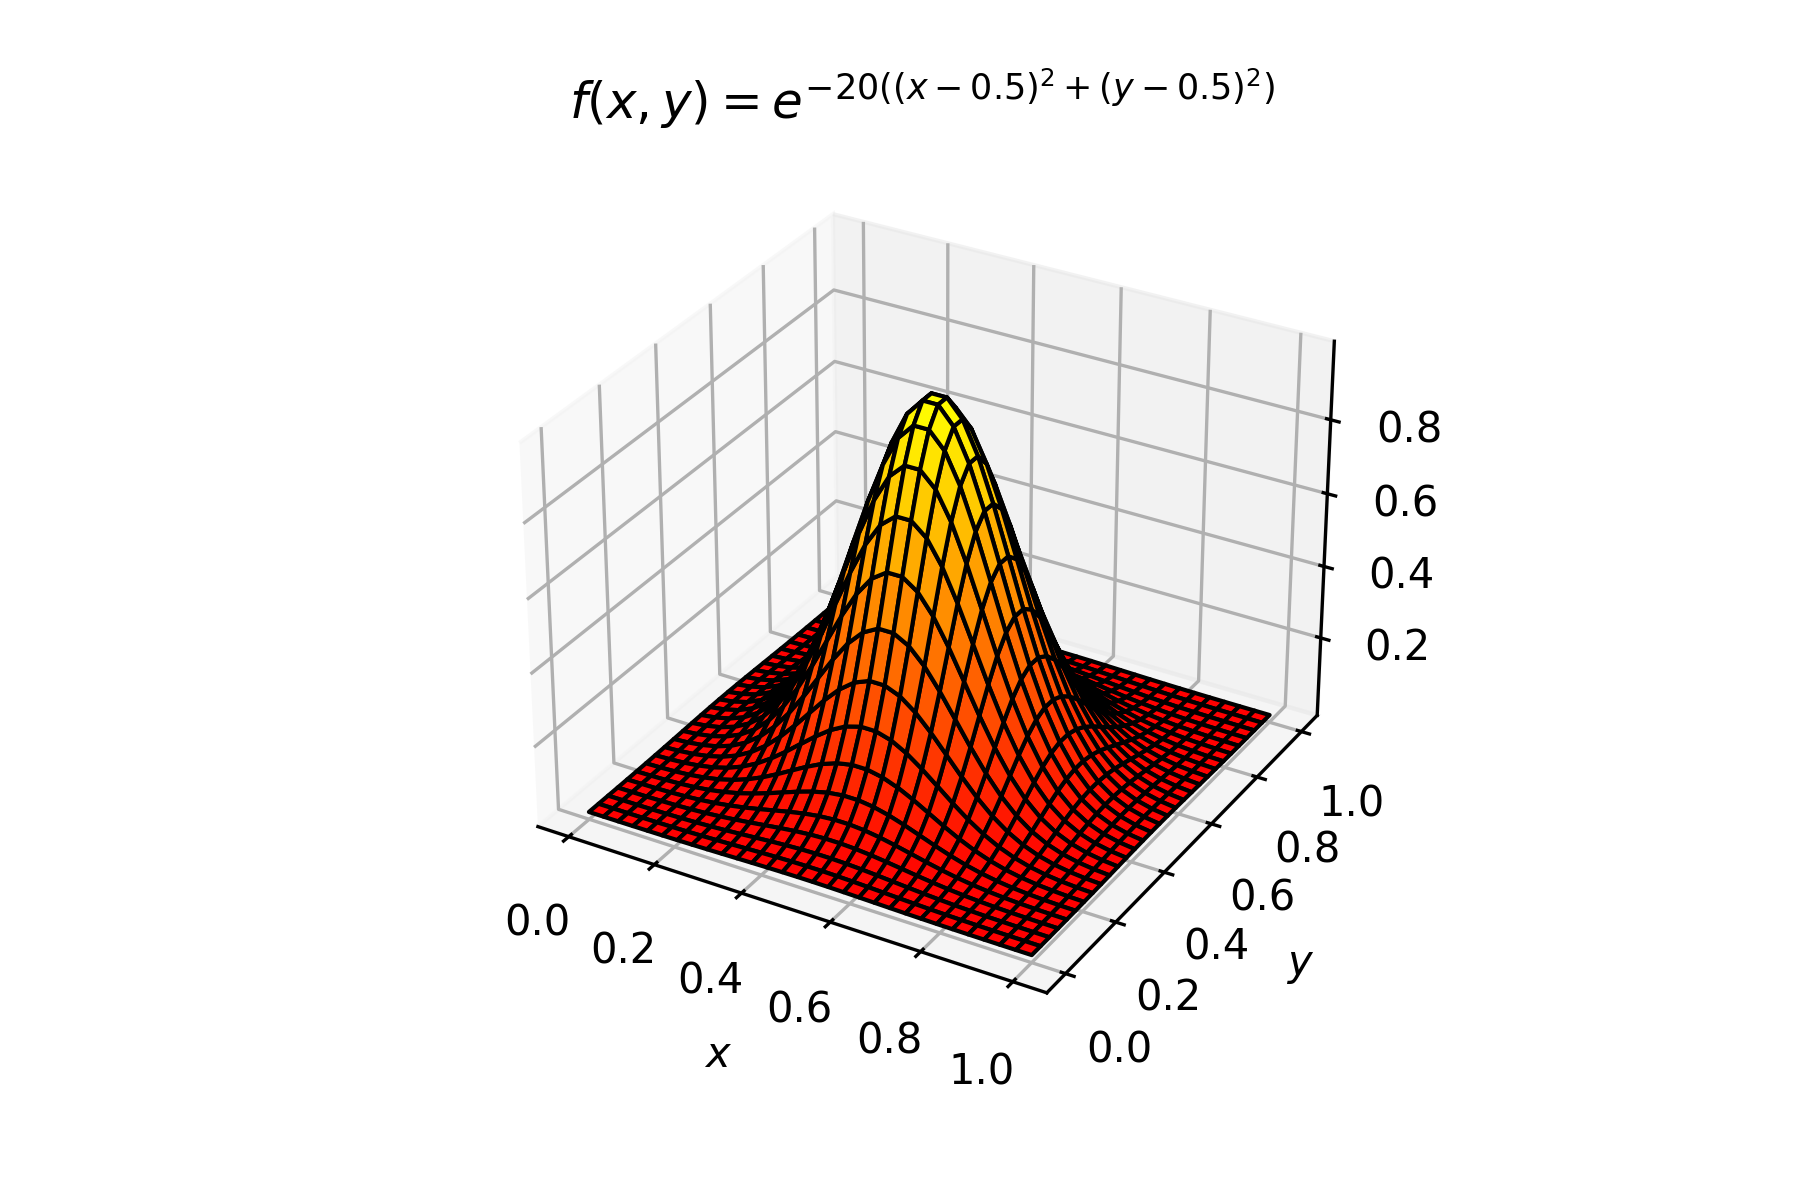
x = np.linspace(0, 1, 30)
y = np.linspace(0, 1, 30)
X, Y = np.meshgrid(x, y)
Z = np.exp(-20 * ((X - 0.5) ** 2 + (Y - 0.5) ** 2))

from mpl_toolkits.mplot3d import Axes3D

fig = plt.figure()
ax = plt.axes(projection='3d')
ax.plot_surface(X, Y, Z, cmap='autumn', ec='k')
plt.xlabel('$x$')
plt.ylabel('$y$')
plt.title('$f(x,y) = e^{-20((x - 0.5)^2 + (y - 0.5)^2)}$')
plt.show()
Output
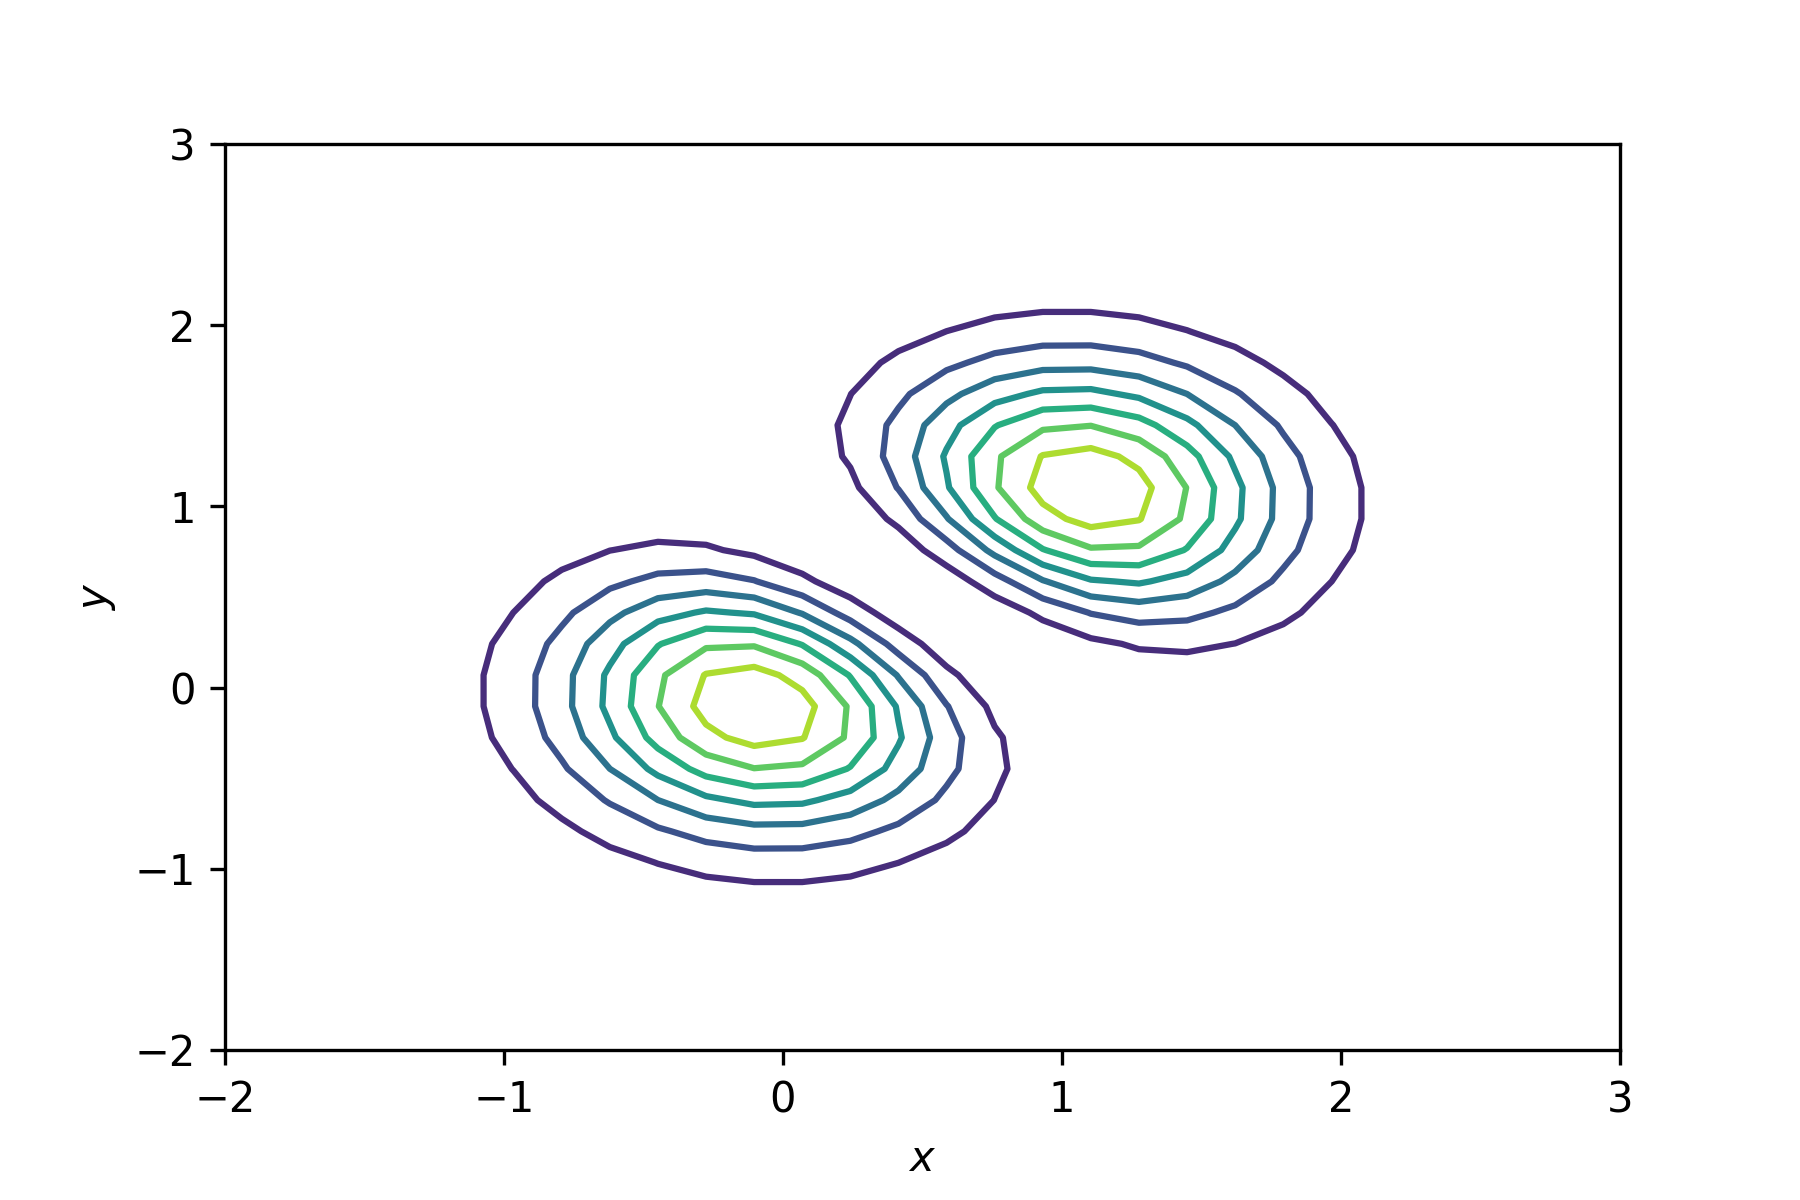
Solution to Exercise 6.8
# Exercise 6.8
x = np.linspace(-2, 3, 30)
y = np.linspace(-2, 3, 30)
X, Y = np.meshgrid(x, y)
Z = (np.exp(-X ** 2 - Y ** 2) - np.exp(-(X - 1) ** 2 - (Y - 1) ** 2)) ** 2

fig, ax = plt.subplots()
plt.contour(X, Y, Z)
plt.xlabel('$x$')
plt.ylabel('$y$')
plt.show()
Output
Solution to Exercise 6.9
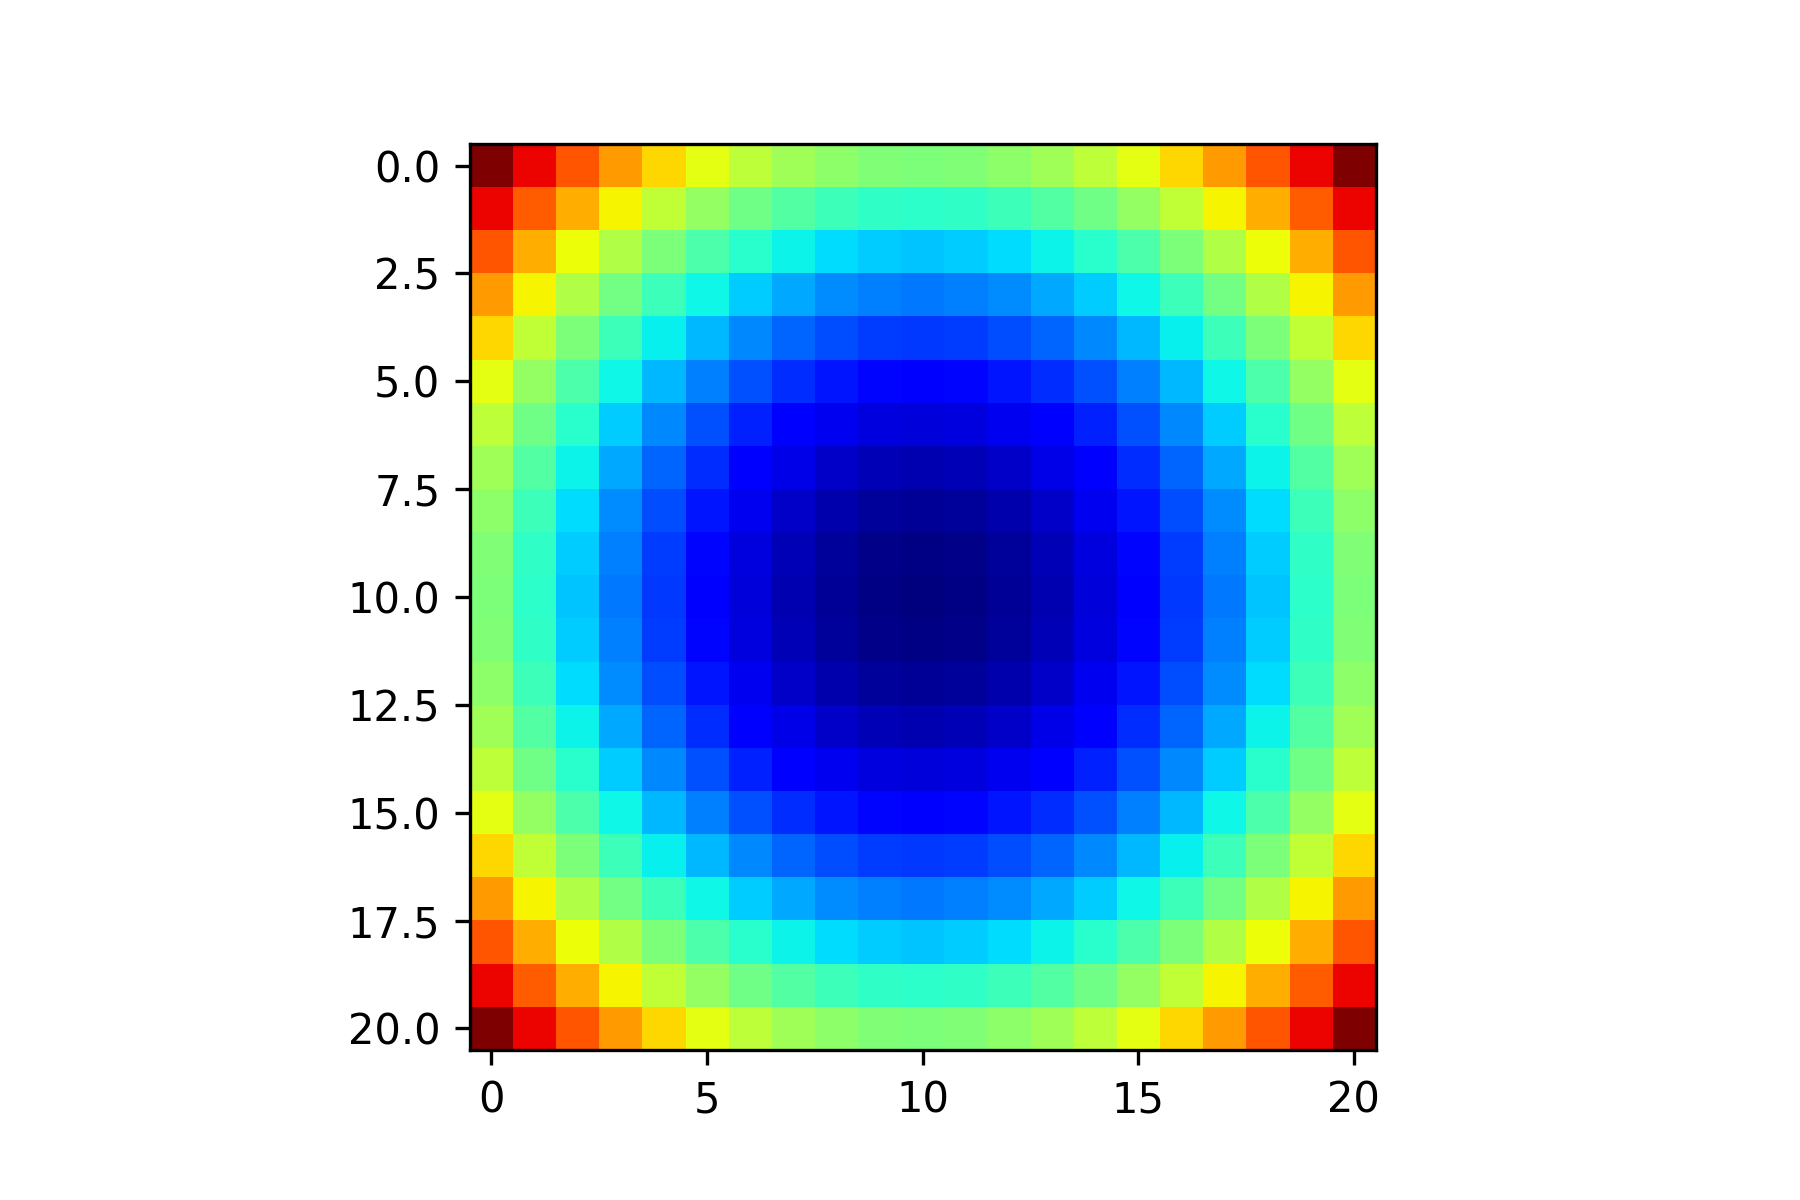
# Exercise 6.9
X = np.zeros((21, 21))

for i in range(21):
    for j in range(21):
        X[i,j] = (i - 10) ** 2 + (j - 10) ** 2

plt.imshow(X, cmap='jet')
plt.show()
Output
Solution to Exercise 6.10
# Exercise 6.10
import matplotlib.image as mpimg

img = mpimg.imread('Dalton_building.jpg')

height, width, colours = img.shape

print("\nReading an image file\n---------------------")
print(f"width       : {width}\nheight      : {height}\nno. colours : {colours}")

plt.imshow(img)
plt.show()
Output
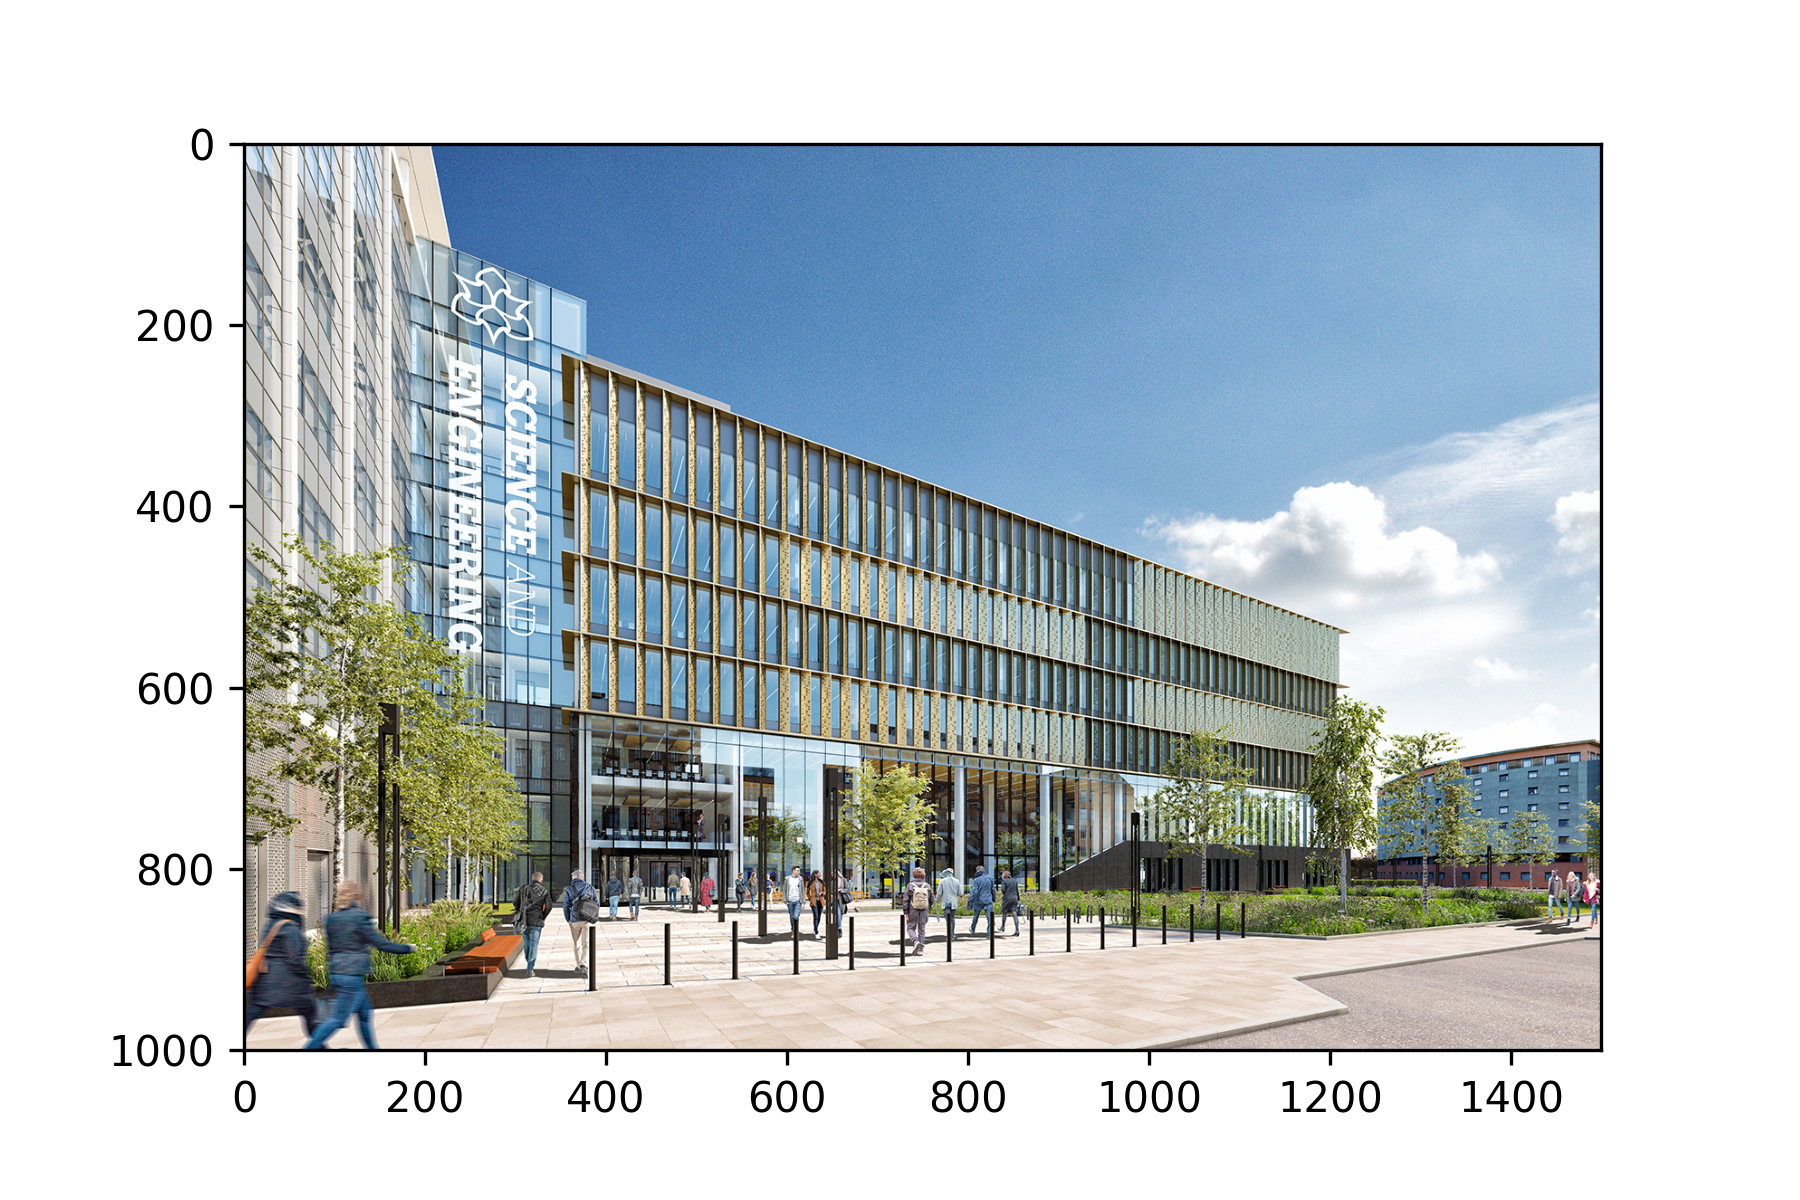
Reading an image file
---------------------
width       : 1500
height      : 1001
no. colours : 3
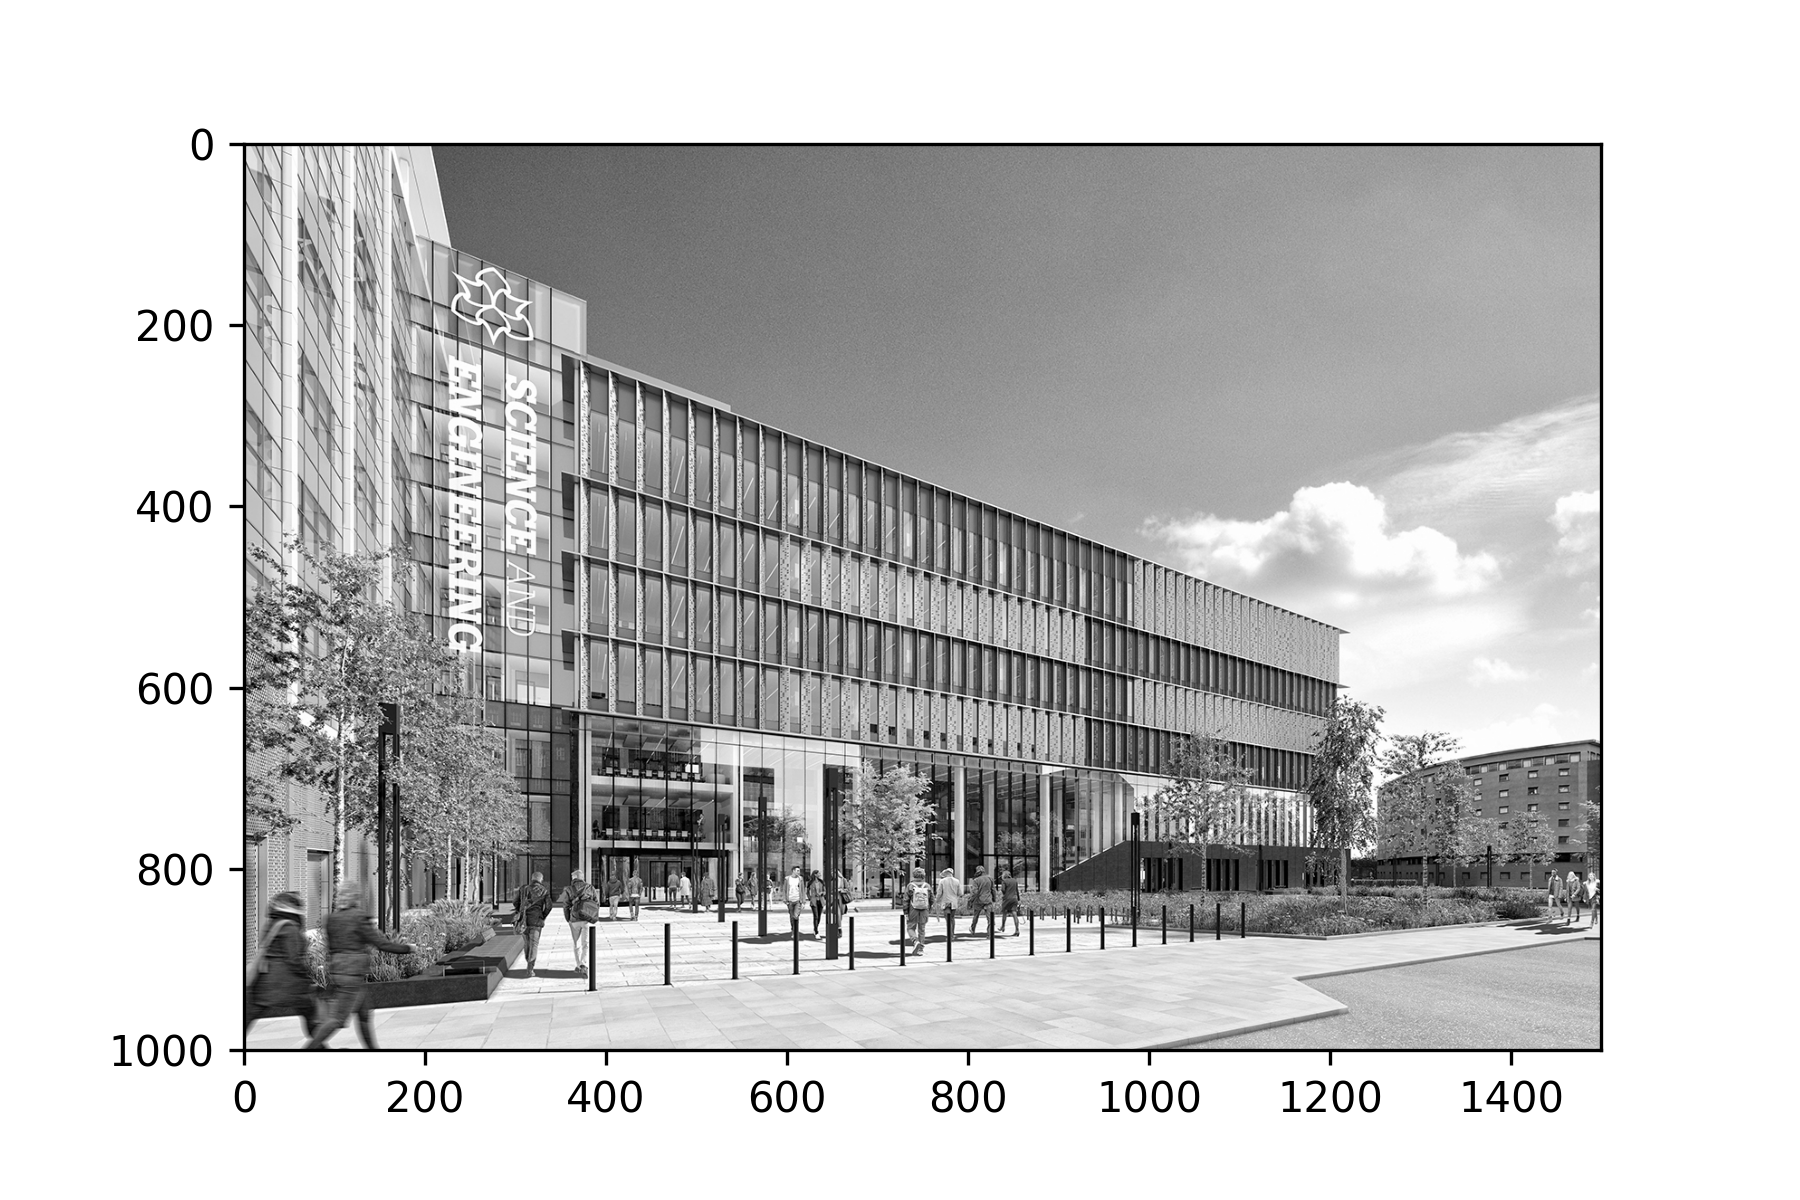
Solution to Exercise 6.11
# Exercise 6.11
img2 = np.copy(img)
red, green, blue = img[:,:,0], img[:,:,1], img[:,:,2]
for k in range(3):
    img2[:,:,k] = 0.299 * red + 0.587 * green + 0.114 * blue

plt.imshow(img2)
plt.show()
Output
